USA Banner

Official US Government Icon

Official websites use .gov
A .gov website belongs to an official government organization in the United States.

Secure Site Icon

Secure .gov websites use HTTPS
A lock ( ) or https:// means you’ve safely connected to the .gov website. Share sensitive information only on official, secure websites.

U.S. Department of Transportation U.S. Department of Transportation Icon United States Department of Transportation United States Department of Transportation

Motor Vehicle Traffic Fatalities by Rural or Urban Location: 2010–2022

Figure
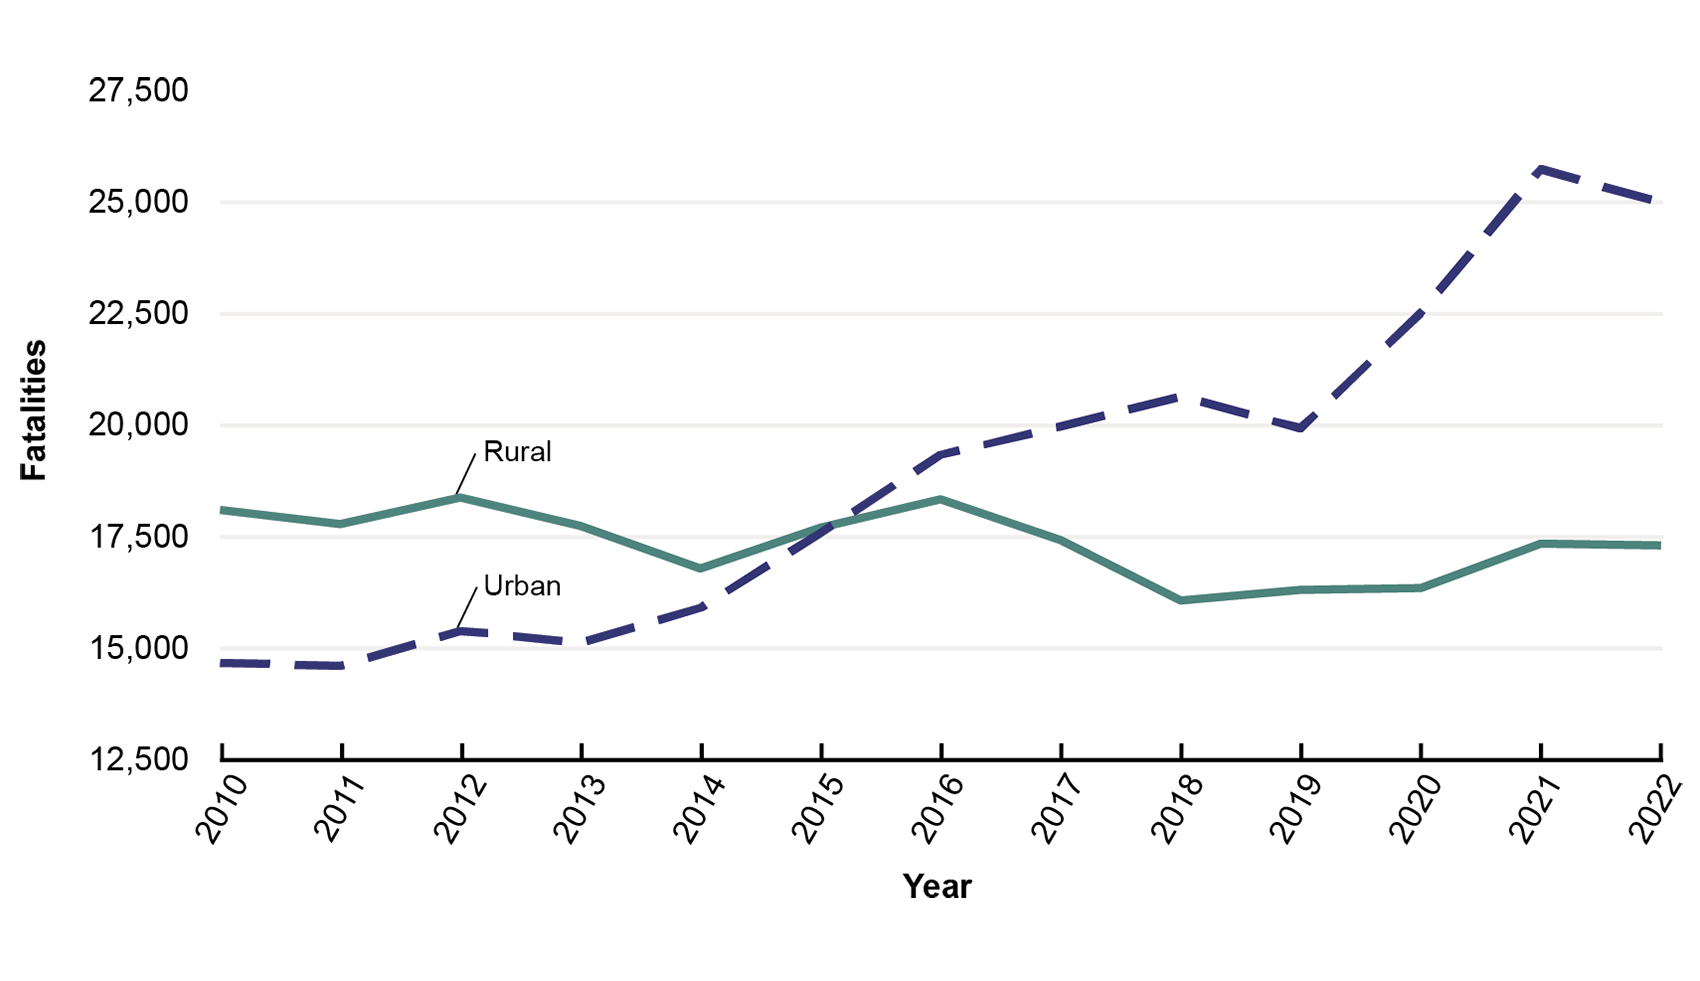
This line graph illustrates motor vehicle traffic fatalities by location. The x-axis represents year and ranges from 2010 through 2022. The y-axis represents fatalities and ranges from 12,500 through 27,500. Data are plotted for rural and urban locations. Over time, rural fatality data show minor fluctuations, beginning just above 18,000 in 2017 and dipping to about 17,300 in 2022. Urban fatalities generally increase from year to year, beginning below 15,000 in 2010 and increasing to above 25,000 in 2022.

Notes:

The change in 2010 2022 fatality numbers between urban and rural areas could be affected to some extent by differing criteria used to identify urban and rural boundaries in the 2010 and 2020 Censuses. For more information about the criteria changes, refer to the U.S. Bureau of the Census report Differences to the Final 2020 Census Urban Area Criteria and the 2010 Census Urban Area Criteria available at 2020 Census Urban Area FAQs as of November 2024.

Description:

This table is from the 2024 Transportation Statistics Annual Report.

Source:

Source: U.S. Department of Transportation, National Highway Traffic Safety Administration. Quick Facts 2022, "Urban Versus Rural Fatalities" April 2024. DOT HS 813 563. Available at www.nhtsa.gov/ as of July 2024.

Publications: