USA Banner

Official US Government Icon

Official websites use .gov
A .gov website belongs to an official government organization in the United States.

Secure Site Icon

Secure .gov websites use HTTPS
A lock ( ) or https:// means you’ve safely connected to the .gov website. Share sensitive information only on official, secure websites.

U.S. Department of Transportation U.S. Department of Transportation Icon United States Department of Transportation United States Department of Transportation

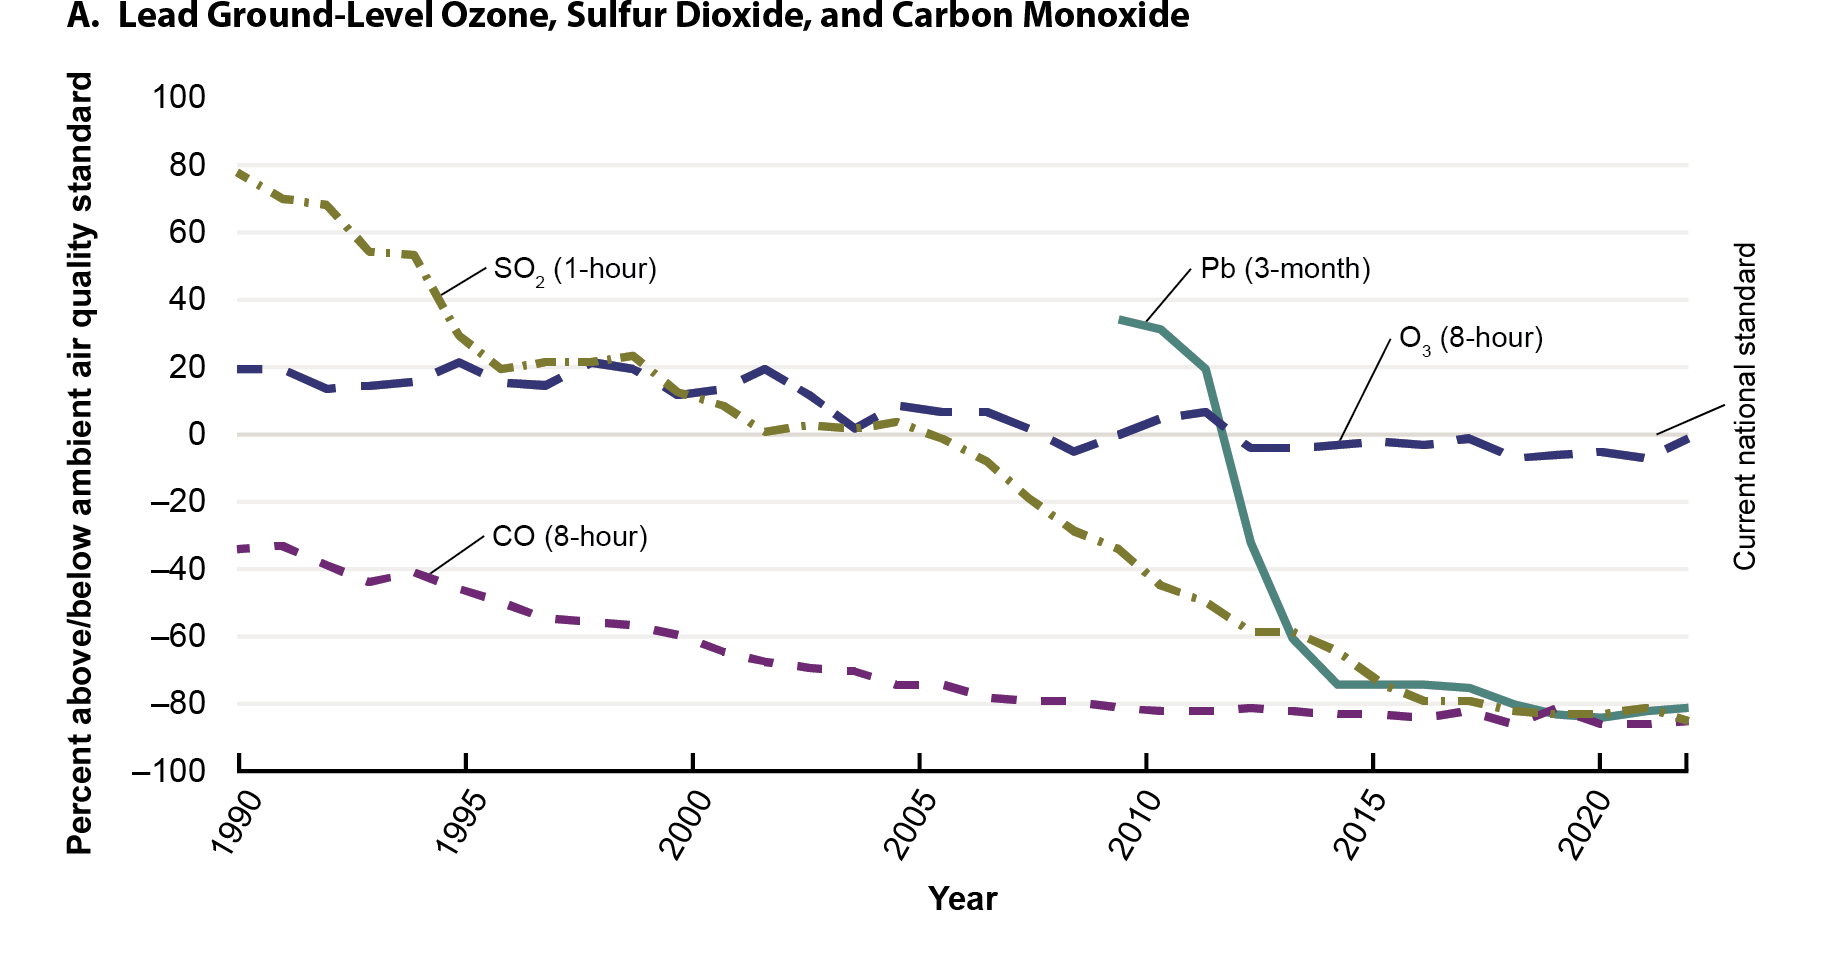
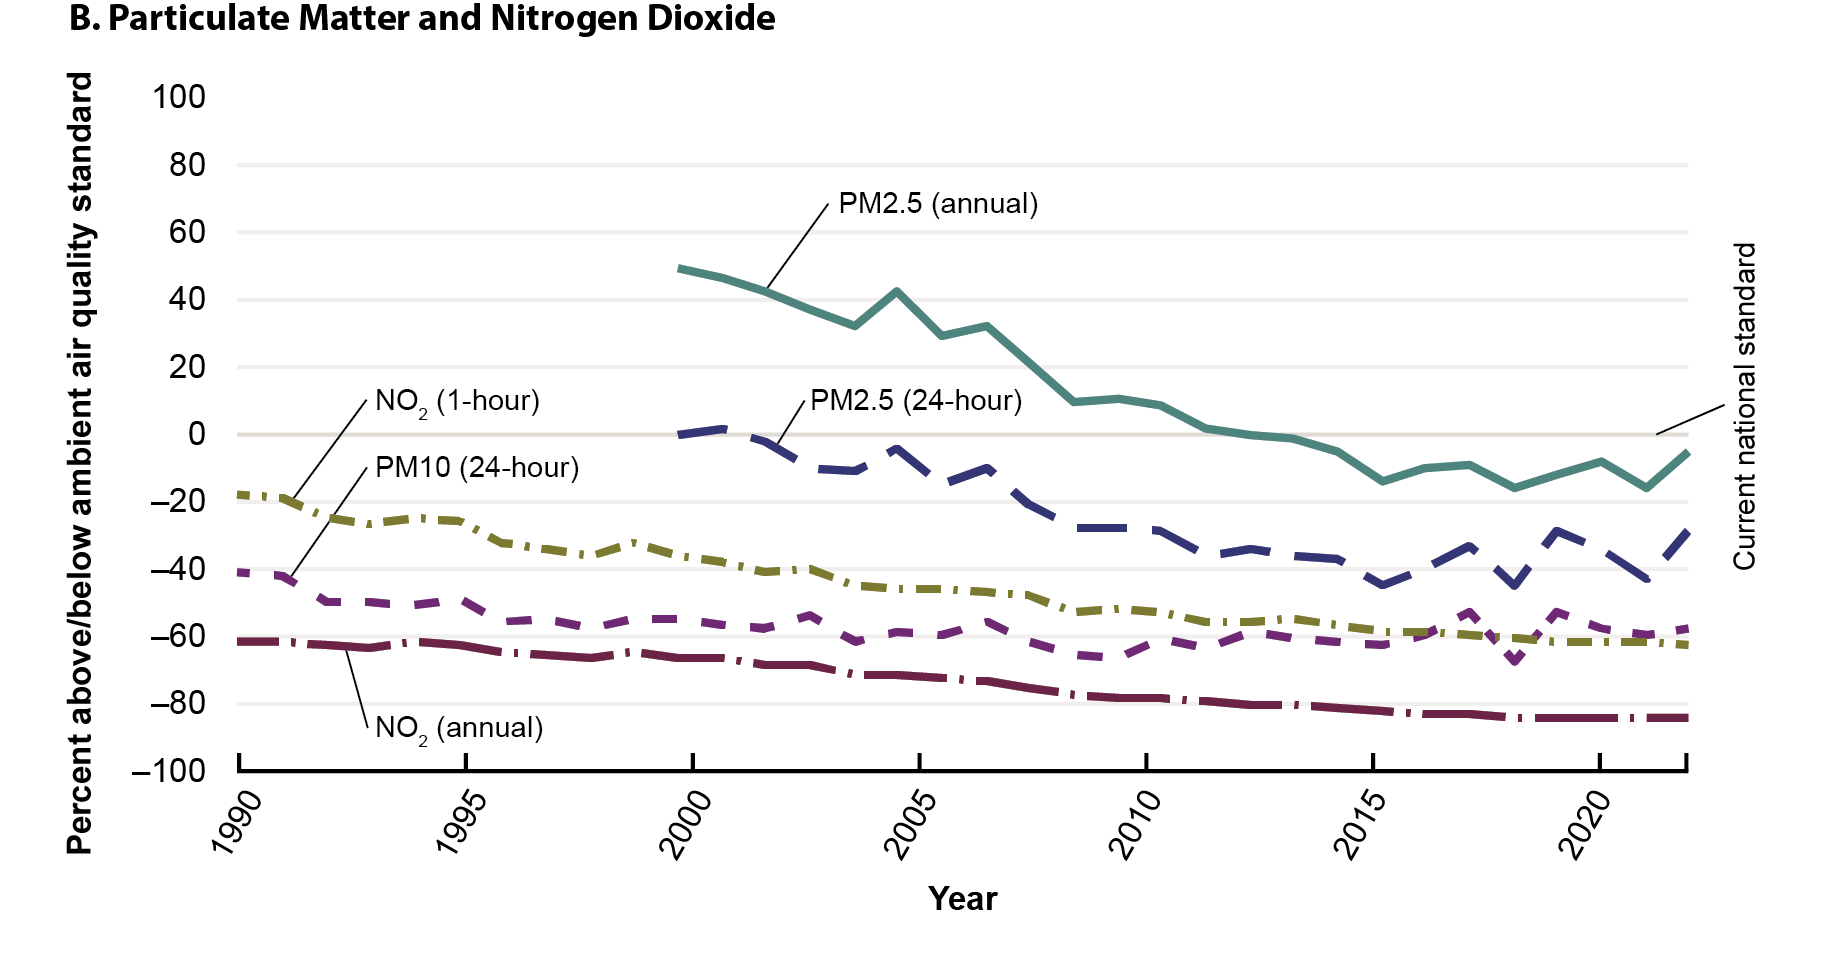
National Average Air Pollutant Concentrations: 1990–2023

Figure

This line graph shows the national average air pollutants presented by the percent above or below the ambient air quality standard. All four concentrations of air pollutant metrics have remained below the current national standard since before 2015. This line graph shows the national average air pollutants presented by the percent above or below the ambient air quality standard. All five concentrations of air pollutant metrics have remained below the current national standard since before 2015.

Description:

This bar chart is from the 2024 Transportation Statistics Annual Report.

Source:

U.S. Environmental Protection Agency, 2023. Our Nation’s Air: Trends Through 2022, available at https://gispub.epa.gov/air/trendsreport/2023/#introduction as of August 2024.

Pb = lead; O3 = ground-level ozone; CO = carbon monoxide; PM = particulate matter; NO2 = nitrogen dioxide; SO2 = sulfer dioxide.
 

Publications: