USA Banner

Official US Government Icon

Official websites use .gov
A .gov website belongs to an official government organization in the United States.

Secure Site Icon

Secure .gov websites use HTTPS
A lock ( ) or https:// means you’ve safely connected to the .gov website. Share sensitive information only on official, secure websites.

U.S. Department of Transportation U.S. Department of Transportation Icon United States Department of Transportation United States Department of Transportation

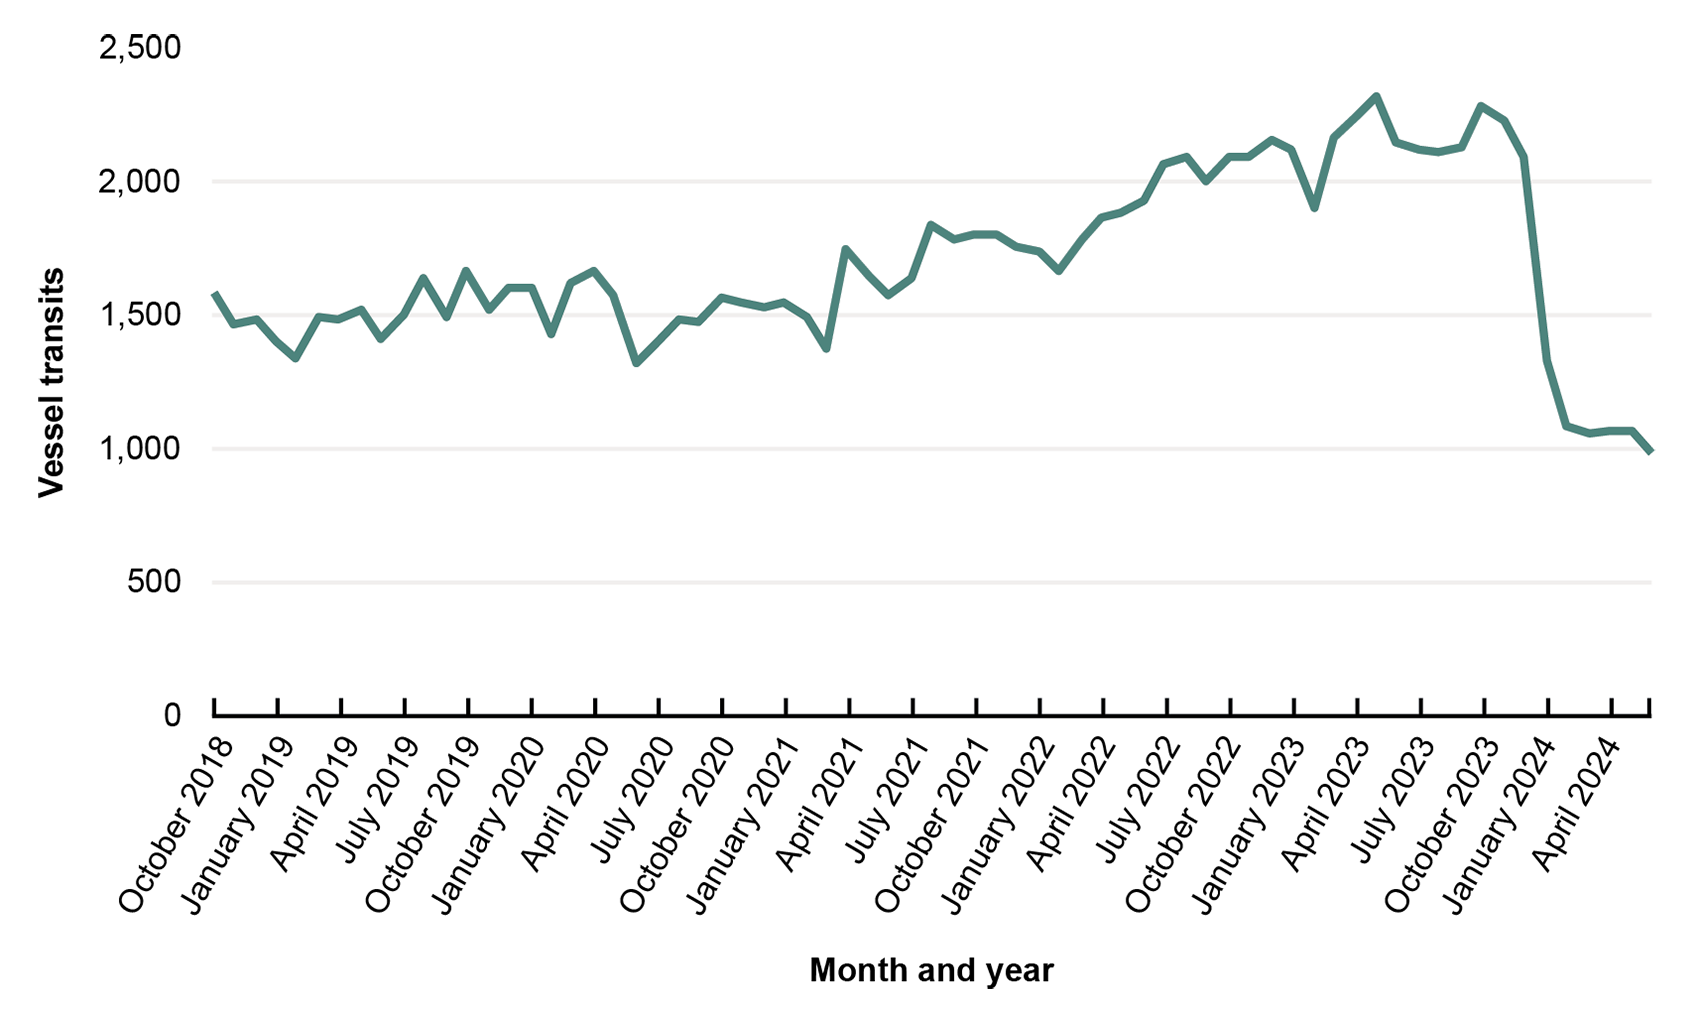
Suez Canal Vessel Transits: October 2018-June 2024

Figure

This line graph shows the number of vessel transits over time. The x-axis represents month and year and ranges from October 2018 through March 2024. The y-axis represents vessel transits and ranges from 0 through 2,500. Vessel transits begin just above 1,500 in October 2018, and fluctuate until about Aril 2021, when transits begin to rise to a peak of about 2,300 in August 2023. After this peak, transits sharply decline to about 1,000 in March 2024.

Description:

This graph is from the 2024 Transportation Statistics Annual Report.

Source:

UNCTAD, “Navigating Troubled Waters: Impact to Global Trade of Disruption of Shipping Routes in the Red Sea, Black Sea and Panama Canal,” UNCTAD Rapid Assessment, February 2024, available at https://unctad.org/publication/navigating-troubled-waters-impact-global-trade-disruption-shipping-routes-red-sea-black#anchor_download; and UN Office for the Coordination of Humanitarian Affairs (OCHA)/Humanitarian Data Exchange (HDX), “Red Sea crisis: Suez Canal traffic impacts,” Panama and Suez Canal Transits dataset, available at https://data.humdata.org/dataset/the-red-sea-suez-canal-traffic.

Publications: