USA Banner

Official US Government Icon

Official websites use .gov
A .gov website belongs to an official government organization in the United States.

Secure Site Icon

Secure .gov websites use HTTPS
A lock ( ) or https:// means you’ve safely connected to the .gov website. Share sensitive information only on official, secure websites.

U.S. Department of Transportation U.S. Department of Transportation Icon United States Department of Transportation United States Department of Transportation

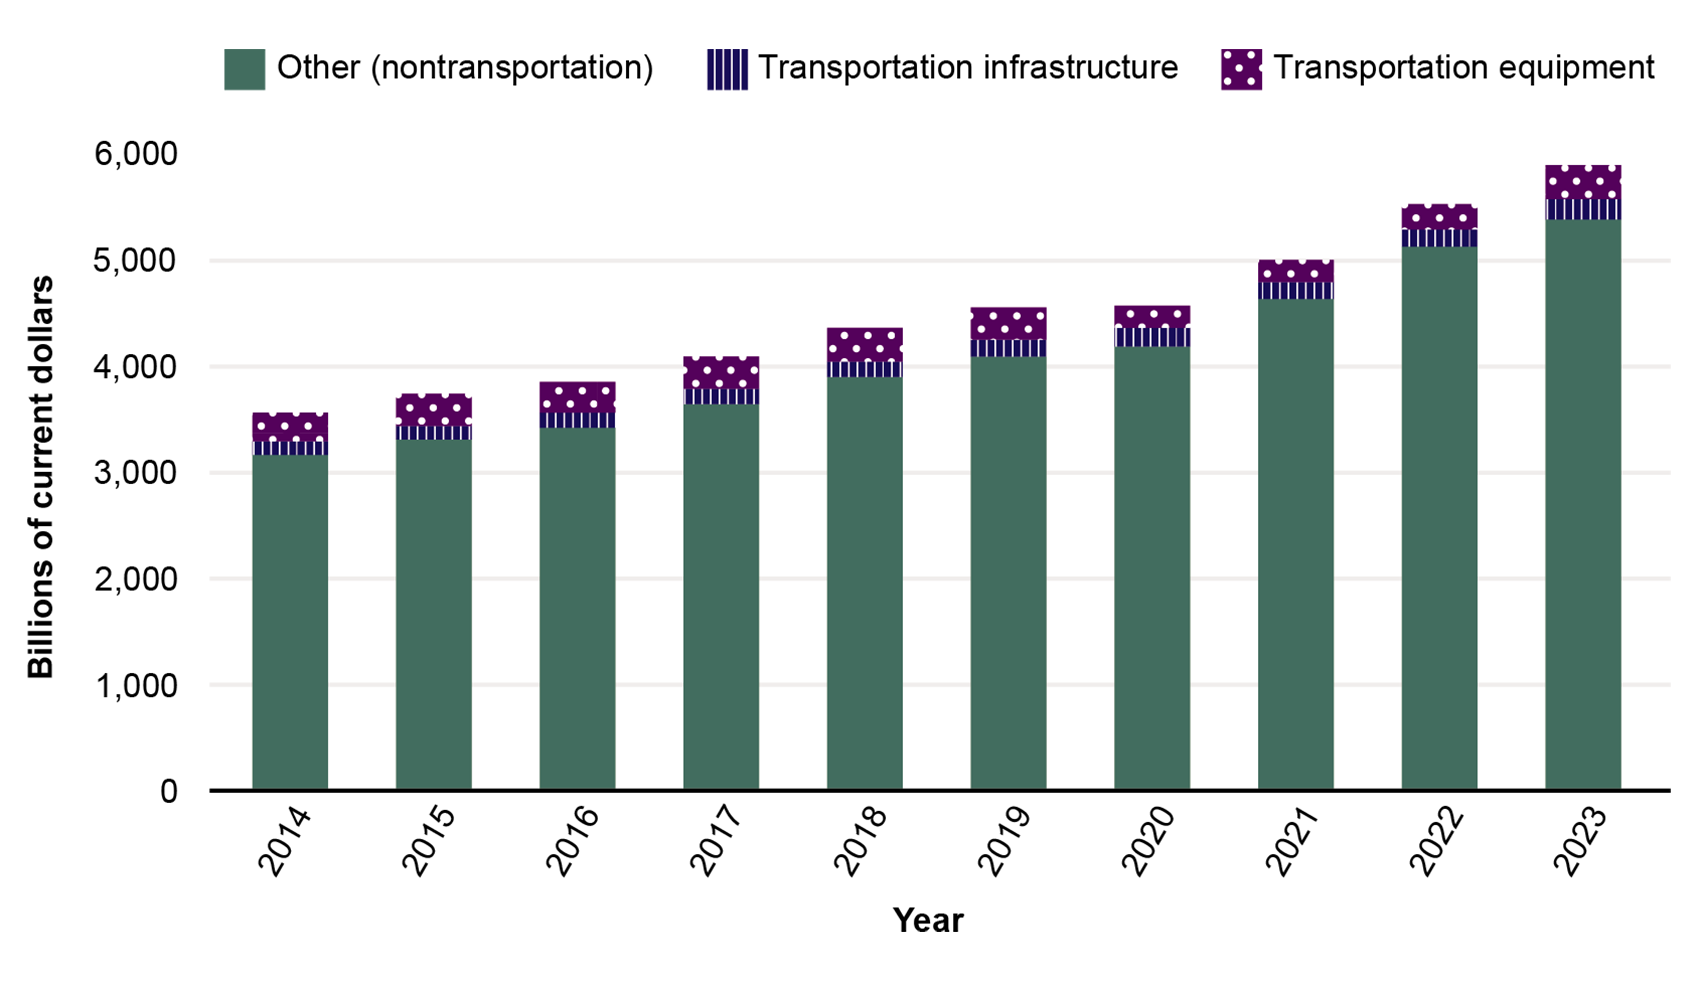
Total Investment and Transportation Investment in Fixed Assets: 2014–2023

Figure

This bar graph shows the investment in billions of current dollars and the percentage of total U.S. investments for transportation equipment, transportation infrastructure, non-transportation. Investments have increased from 2014 to 2023. In 2023, total U.S. investments in fixed assets was nearly 6 trillion dollars. Out of the total, transportation equipment investments made up about 9 percent of investments and transportation infrastructure made up about 5 percent of investments.

Dataset Excel:

F4_15_Public&PrivateInvestment_A_v3.xlsx (1.36 MB)

Notes:

 Totals may not sum due to rounding. The investment includes spending on new structures and equipment and excludes maintenance and repair of existing structures and equipment. Intellectual property products are research and development; software; and entertainment, literary, and artistic originals.

Description:

This bar chart is from the 2024 Transportation Statistics Annual Report.

Source:

U.S. Department of Commerce, Bureau of Economic Analysis, National Income and Product Accounts, National Income and Product Account Tables, Private Fixed Investment in Structures by Type, table 5.4.5 (millions), Private Fixed Investment in Equipment by Type, table 5.5.5 (millions), and Gross Government Fixed Investment by Type, table 5.9.5 (millions), available at https://apps.bea.gov/iTable/index_nipa.cfm as of September 2024.

Publications: