USA Banner

Official US Government Icon

Official websites use .gov
A .gov website belongs to an official government organization in the United States.

Secure Site Icon

Secure .gov websites use HTTPS
A lock ( ) or https:// means you’ve safely connected to the .gov website. Share sensitive information only on official, secure websites.

U.S. Department of Transportation U.S. Department of Transportation Icon United States Department of Transportation United States Department of Transportation

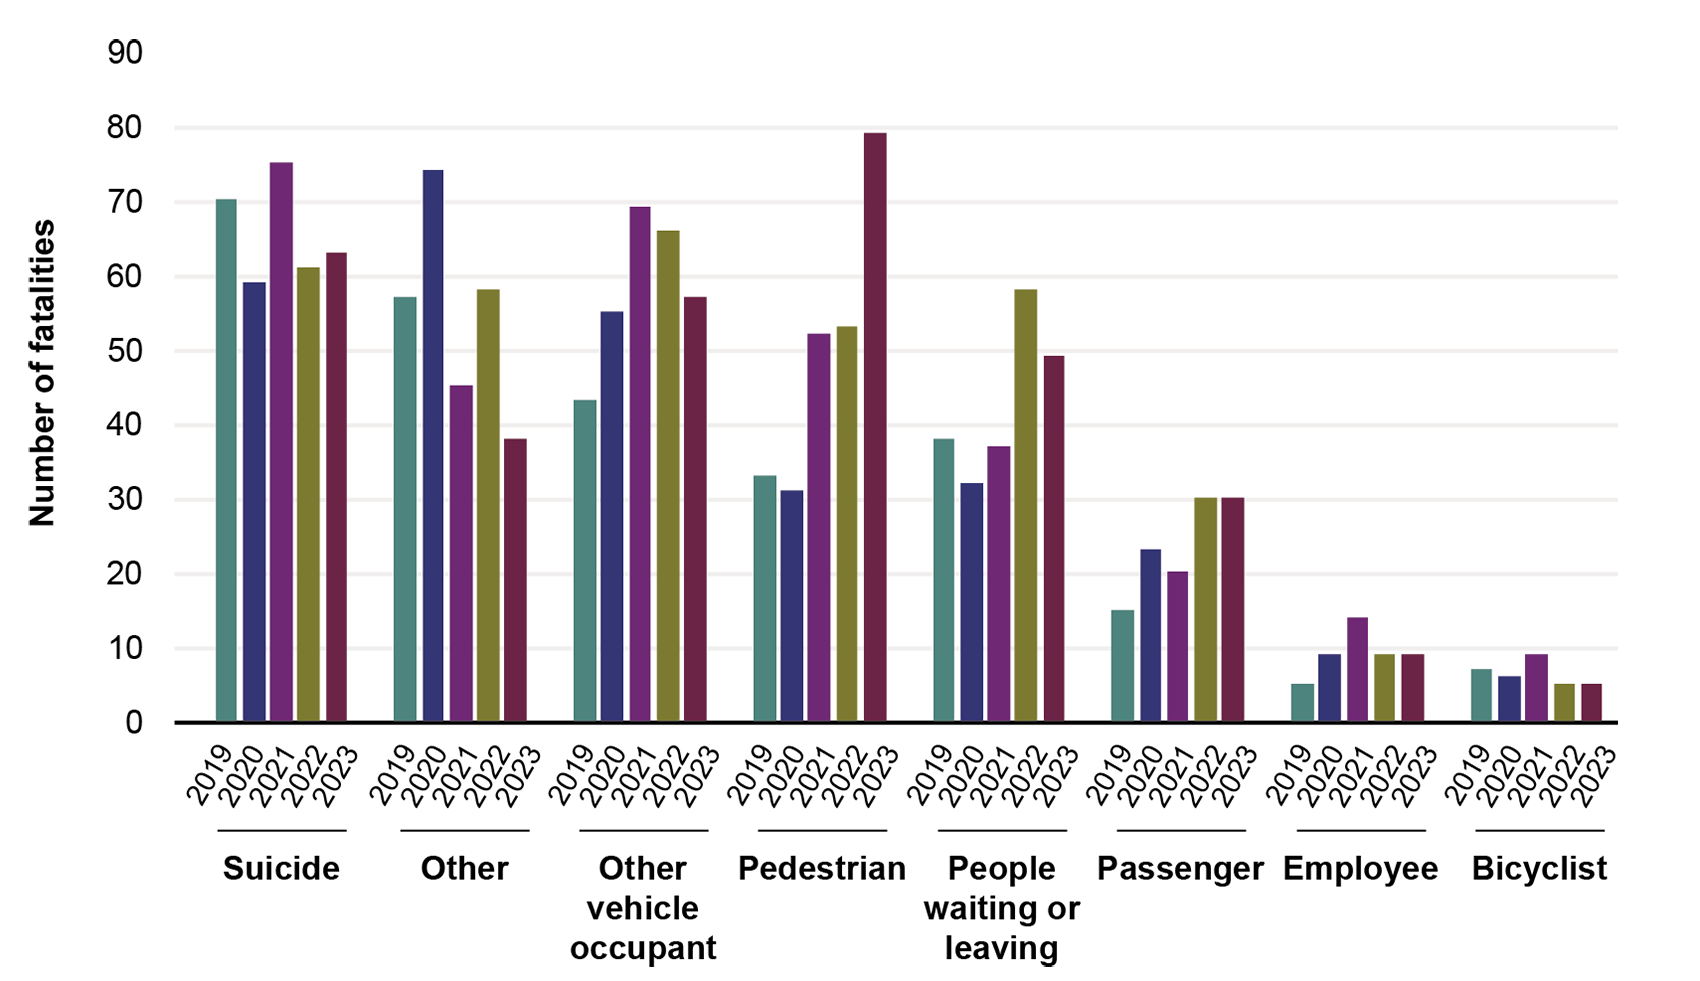
Transit Fatalities by Category: 2019–2023

Figure

This cluster bar graph illustrates transit fatalities by category and year. The x-axis shows the following categories: suicide, other, other vehicle occupant, pedestrian, people waiting or leaving, passenger, employee, bicyclist. Each category shows data for the years 2019 through 2023. The y-axis represents fatalities and ranges from 0 through 90. Bicyclist and employee by far represent the fewest fatalities over time, with all years except 1 falling between 5 and 10 fatalities for these categories. The ex

Notes:

“Pedestrian” includes in crossings, not in crossings, and walking along track. “Other” includes those killed outside of a vehicle that do not fit in any other category. “Other vehicle occupant” includes the number of occupants of other vehicles killed.

Description:

This table is from the 2024 Transportation Statistics Annual Report.

Source:

U.S. Department of Transportation, Federal Transit Administration, National Transit Database, available at https://www.transit.dot.gov/ntd as of July 2024.

Publications: