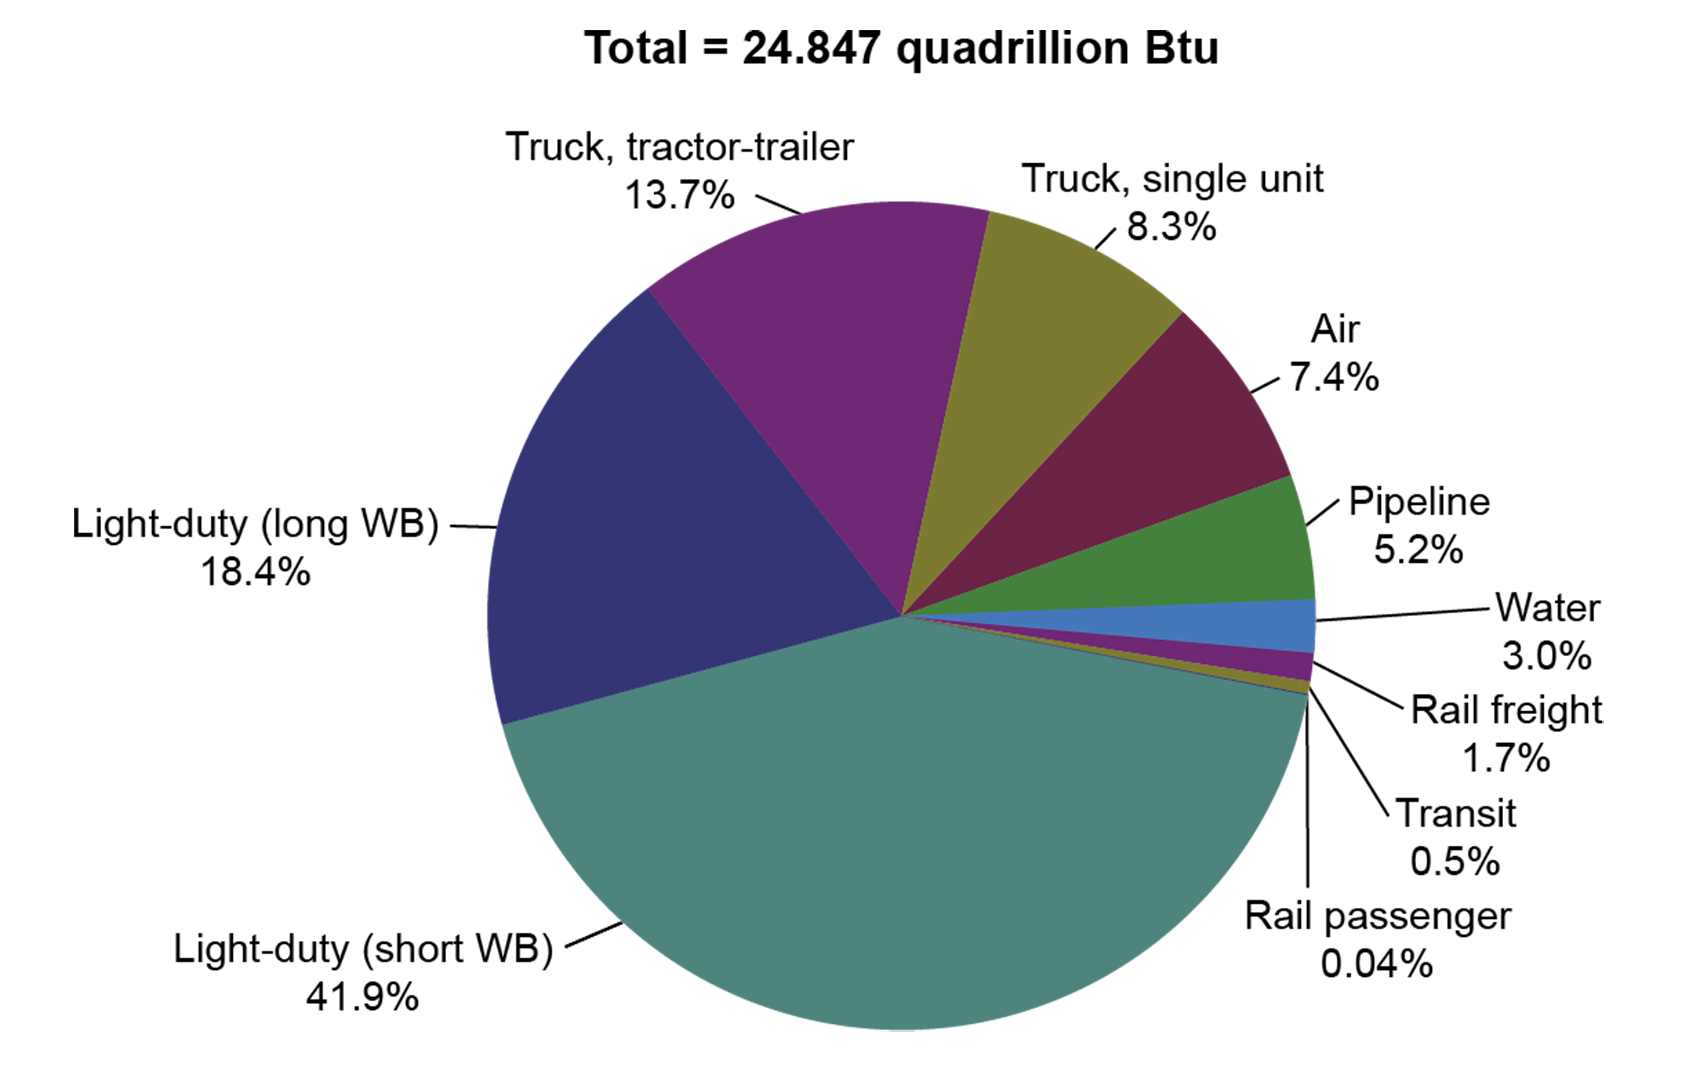
Transportation Energy Use by Mode 2022
Key: WB = Wheelbase
Figure

Dataset Excel:
F6-2 Energy Use by Mode.xlsx (76.61 KB)Notes:
The following conversion rates were used: jet fuel = 135,000 Btu/gallon; aviation gasoline = 120,200 Btu/gallon; automotive gasoline = 125,000 Btu/gallon; diesel motor fuel = 138,700 Btu/gallon; compressed natural gas = 138,700 Btu/gallon; distillate fuel = 138,700 Btu/gallon; residual fuel = 149,700 Btu/gallon; natural gas = 1,031 Btu/ft3; electricity 1kWh = 3,412 Btu, negating electrical system losses. To include approximate electrical system losses, multiply this conversion factor by 3.
Source:
U.S. Department of Transportation, Federal Aviation Administration, Federal Highway Administration, and Federal Transit Administration; U.S. Department of Energy, Nationnal Railroad Passenger Corporation (Amtrak); and Association of American Railroads as cited in Bureau of Transportation Statistics, National Transportation Statistics, table 4-6, available at www.bts.gov as of August 2024.
