dot-bts
United States Department of Transportation
Ask-A-Librarian
A-Z Index
NTL
Search form
GO
Main menu
Explore Topics and Geography
Topics
Airlines and Airports
Energy and Environment
Freight Transportation
Infrastructure
Passenger Travel
Safety
System Performance
Transportation and the Economy
Geography
Geospatial Portal
Map Gallery
International
National
By State
Modes
Aviation
Highway
Rail
Maritime and Inland Waterways
Pipelines
Transit
Bicycles and Pedestrian
Browse Statistical Products and Data
Information Gallery
A-Z index of BTS Publications
Airline Information for Download
Border Crossing Data
Commodity Flow Survey
Confidential Close Calls Reporting
Freight Analysis Framework
Freight Facts and Figures
GIS Applications
Intermodal Transportation Database
National Census of Ferry Operators
National Transportation Statistics
National Transportation Atlas Database
National Transportation Data Archives
Passenger Travel Facts and Figures
Pocket Guide App
Port Performance Freight Statistics Program
State Transportation Statistics
Tank Car Survey
TransBorder Freight Data
Transportation Economic Accounts
Transportation Economic Trends
Transportation Services Index
Transportation Statistics Annual Reports
Learn About BTS and Our Work
About BTS
Overview
Staff Directory
Advisory Council on Transportation Statistics
Port Performance Working Group
Legislative Mandates
History of BTS
Jobs and Internships
Statistical Methods and Policies
OMB Statistical Policy Directives
BTS Guidelines for Data Collection, Confidentiality, and Statistical Quality
Seasonal Adjustment Methods
Federal Register Notices
Rulemaking
Behind The Numbers: BTS Webinar Series
Newsroom
News/Statistical Releases
Calendar
Release Schedule
Special Topics
You are here
Home
Transportation Economic Trends
Latest Publication
Previous Publication
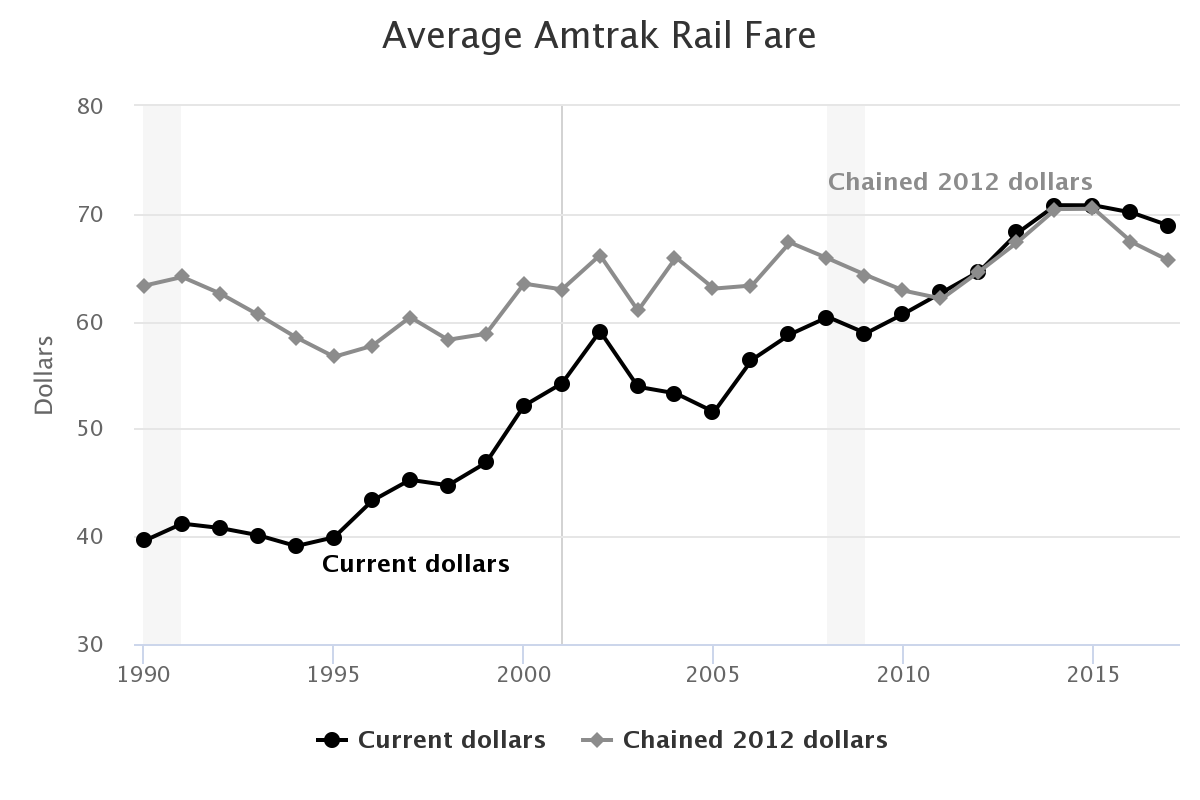
Average Amtrak Rail Fares per Average Trip Length, 1990 to 2014
Share:
Dataset Excel:
TET-2017-fig-3-8.xlsx
Print
Related Items:
Table 1: Freight, Passenger and Combined Transportation Services Indexes Since November 2016, May 2017
Table 3: Freight, Passenger and Combined Transportation Services Indexes Year-to-Date Change, 2008-2017, May 2017
Table 5: Transportation Services Indexes from Previous Years, May 2017