
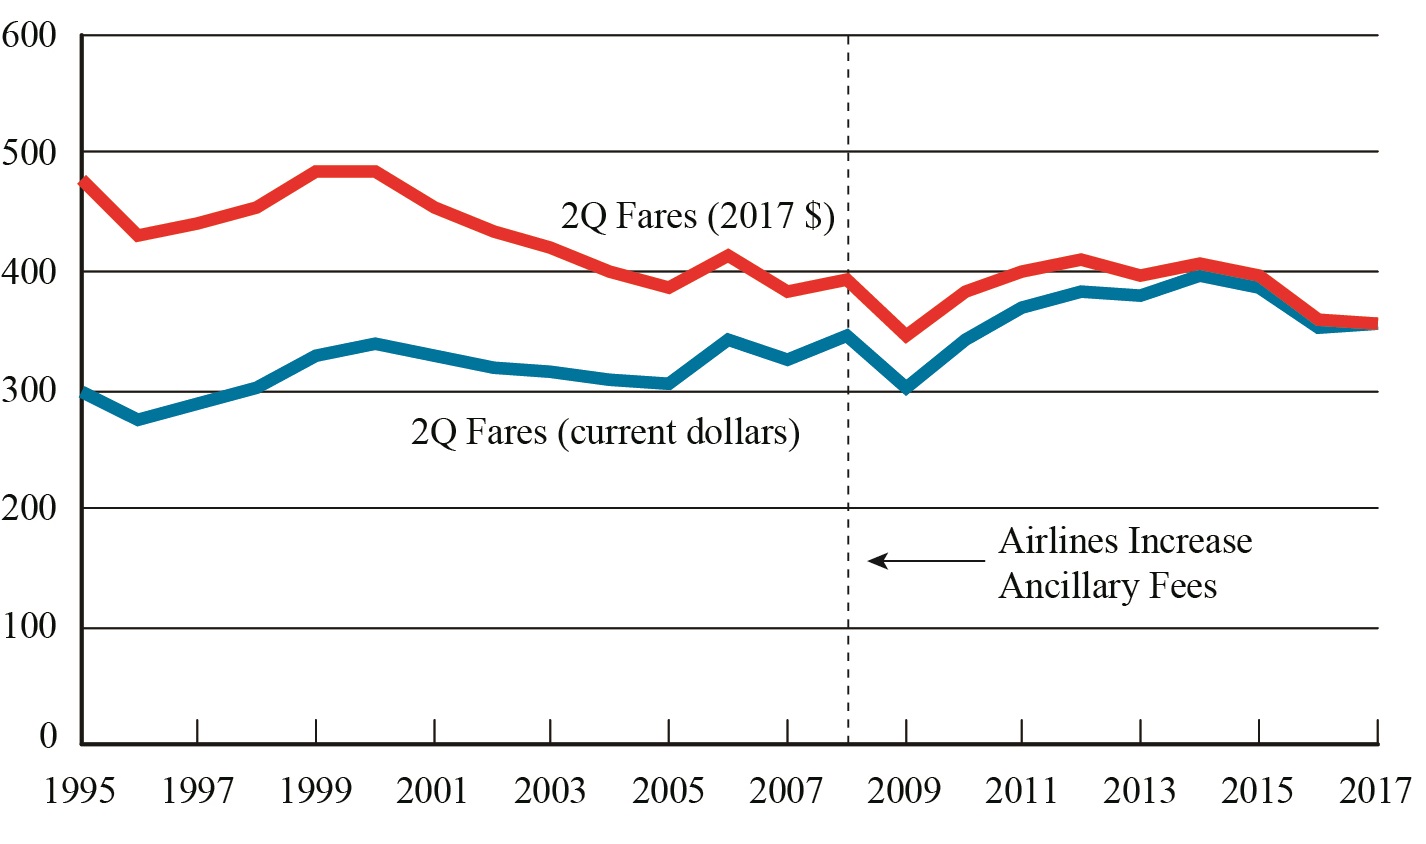
Figure 1. U.S. Average Domestic Fares, 2nd Quarter 1995-2017
Figure
Dataset Table:
| 2Q Fares (current dollars) | 2Q Fares (2017 $) | |
|---|---|---|
| 1995 | 297 | 477 |
| 1996 | 276 | 431 |
| 1997 | 289 | 442 |
| 1998 | 301 | 453 |
| 1999 | 329 | 485 |
| 2000 | 339 | 483 |
| 2001 | 329 | 453 |
| 2002 | 318 | 433 |
| 2003 | 315 | 419 |
| 2004 | 309 | 401 |
| 2005 | 307 | 386 |
| 2006 | 342 | 413 |
| 2007 | 325 | 383 |
| 2008 | 347 | 392 |
| 2009 | 302 | 345 |
| 2010 | 341 | 382 |
| 2011 | 370 | 401 |
| 2012 | 385 | 410 |
| 2013 | 378 | 397 |
| 2014 | 396 | 407 |
| 2015 | 386 | 397 |
| 2016 | 353 | 359 |
| 2017 | 356 | 356 |
Source:
Bureau of Transportation Statistics, Origin and Destination Survey: DB1BTicket