
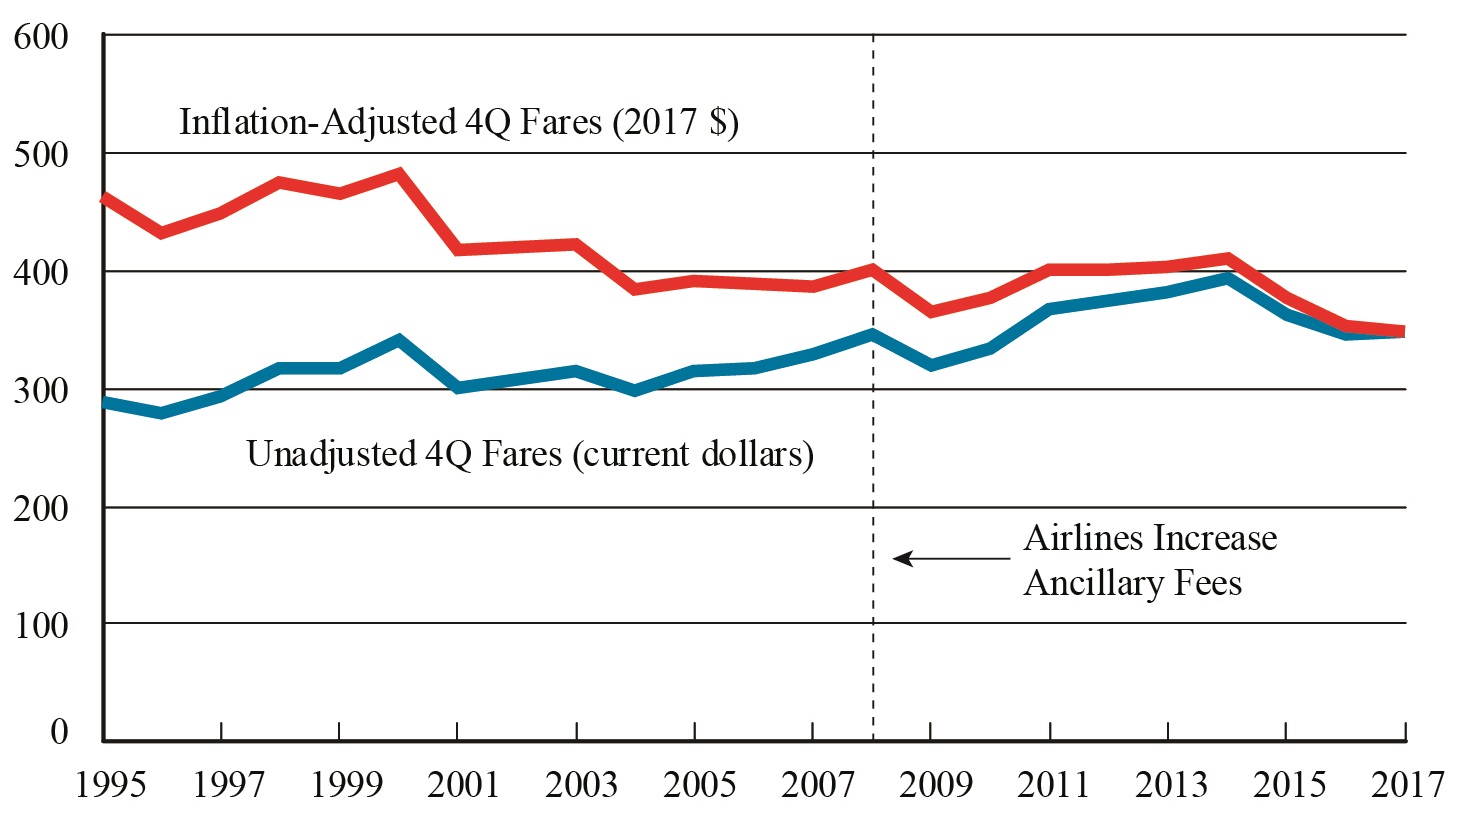
Figure 1. U.S. Average Domestic Fares, 4th Quarter 1995-2017, 4Q 2017
Figure
Dataset Table:
| Unadjusted 4Q Fares (current dollars) | Inflation-Adjusted 4Q Fares (2017 $) | |
|---|---|---|
| 1995 | 288 | 462 |
| 1996 | 278 | 433 |
| 1997 | 294 | 448 |
| 1998 | 316 | 476 |
| 1999 | 318 | 466 |
| 2000 | 340 | 482 |
| 2001 | 300 | 417 |
| 2002 | 309 | 420 |
| 2003 | 316 | 422 |
| 2004 | 297 | 384 |
| 2005 | 315 | 392 |
| 2006 | 318 | 389 |
| 2007 | 330 | 388 |
| 2008 | 345 | 400 |
| 2009 | 320 | 365 |
| 2010 | 335 | 377 |
| 2011 | 368 | 402 |
| 2012 | 374 | 401 |
| 2013 | 382 | 404 |
| 2014 | 393 | 410 |
| 2015 | 363 | 377 |
| 2016 | 347 | 354 |
| 2017 | 347 | 347 |
Source:
Bureau of Transportation Statistics, Origin and Destination Survey