
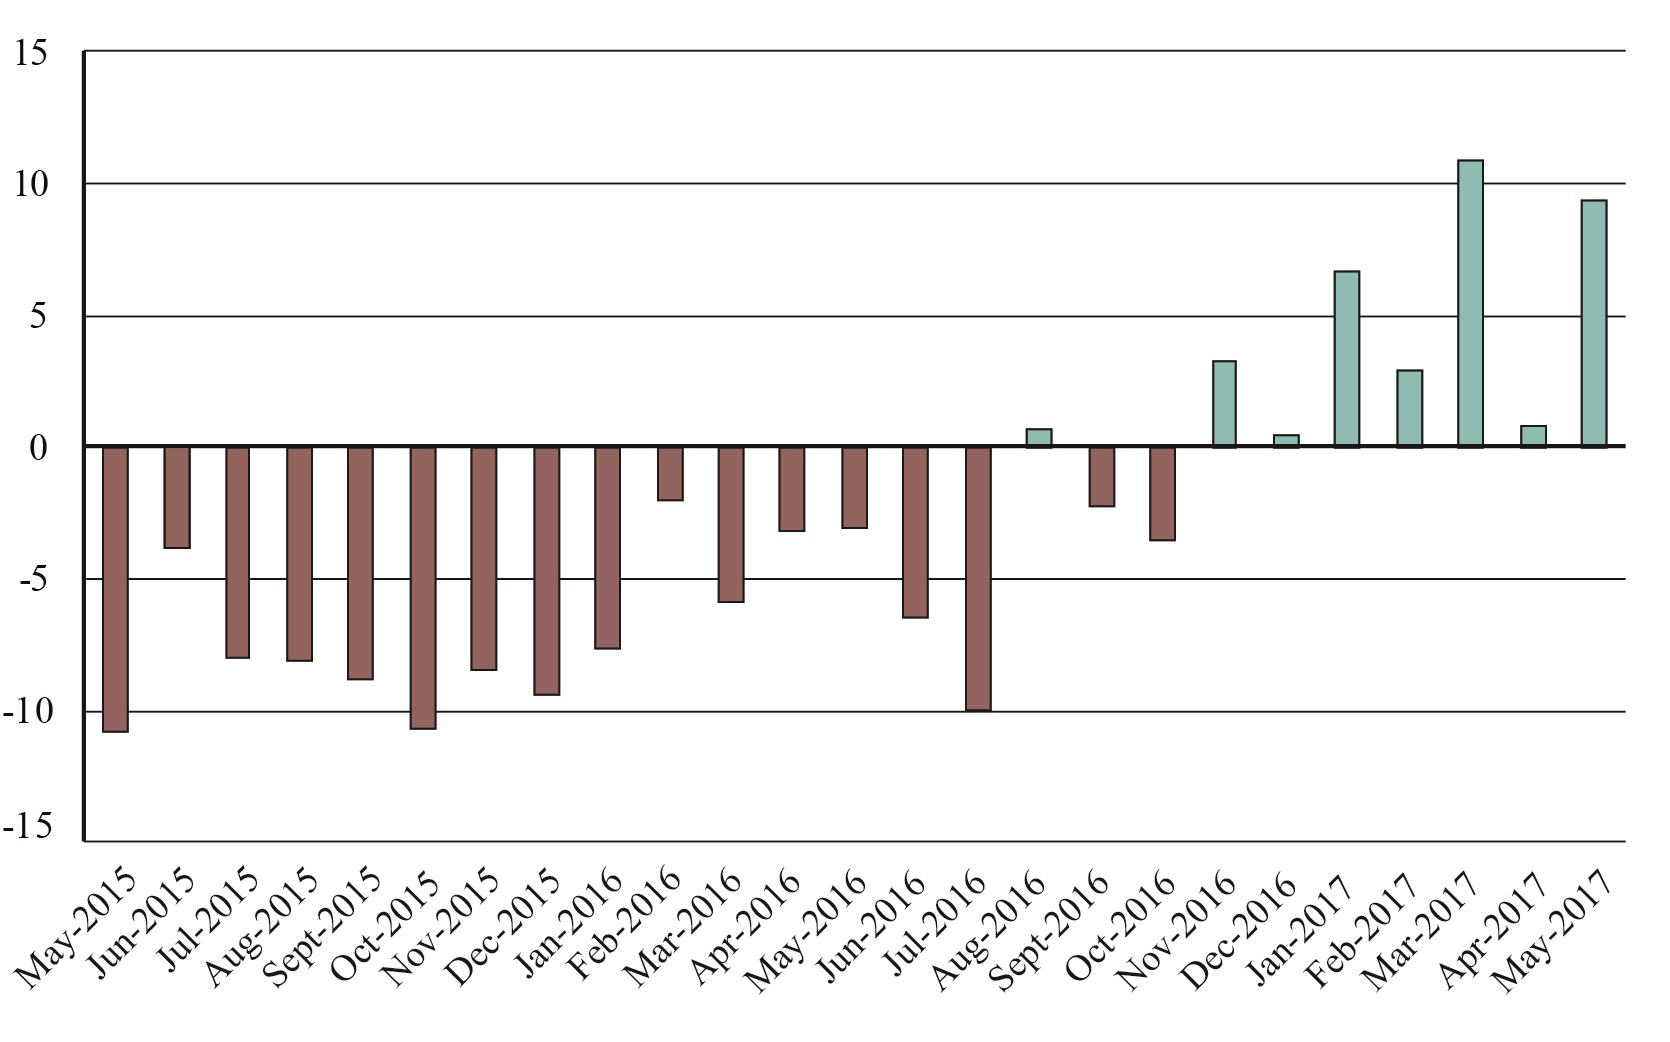
Figure 1. U.S.-NAFTA Freight Value Percent Change from Previous Year (Last 24 months), May 2017
Figure
Dataset Table:
| Figure 1. U.S.-NAFTA Freight Value Percent Change from Previous Year (Last 24 months) | |
|---|---|
| 05/2015 | -10.8 |
| 06/2015 | -3.8 |
| 07/2015 | -8.0 |
| 08/2015 | -8.1 |
| 09/2015 | -8.8 |
| 10/2015 | -10.7 |
| 11/2015 | -8.4 |
| 12/2015 | -9.5 |
| 01/2016 | -7.7 |
| 02/2016 | -2.0 |
| 03/2016 | -5.8 |
| 04/2016 | -3.2 |
| 05/2016 | -3.1 |
| 06/2016 | -6.4 |
| 07/2016 | -10.0 |
| 08/2016 | 0.7 |
| 09/2016 | -2.3 |
| 10/2016 | -3.6 |
| 11/2016 | 3.3 |
| 12/2016 | 0.4 |
| 01/2017 | 6.7 |
| 02/2017 | 2.9 |
| 03/2017 | 10.9 |
| 04/2017 | 0.8 |
| 05/2017 | 9.4 |
Source:
Bureau of Transportation Statistics, TransBorder Freight Data, https://data.bts.gov/stories/s/myhq-rm6q