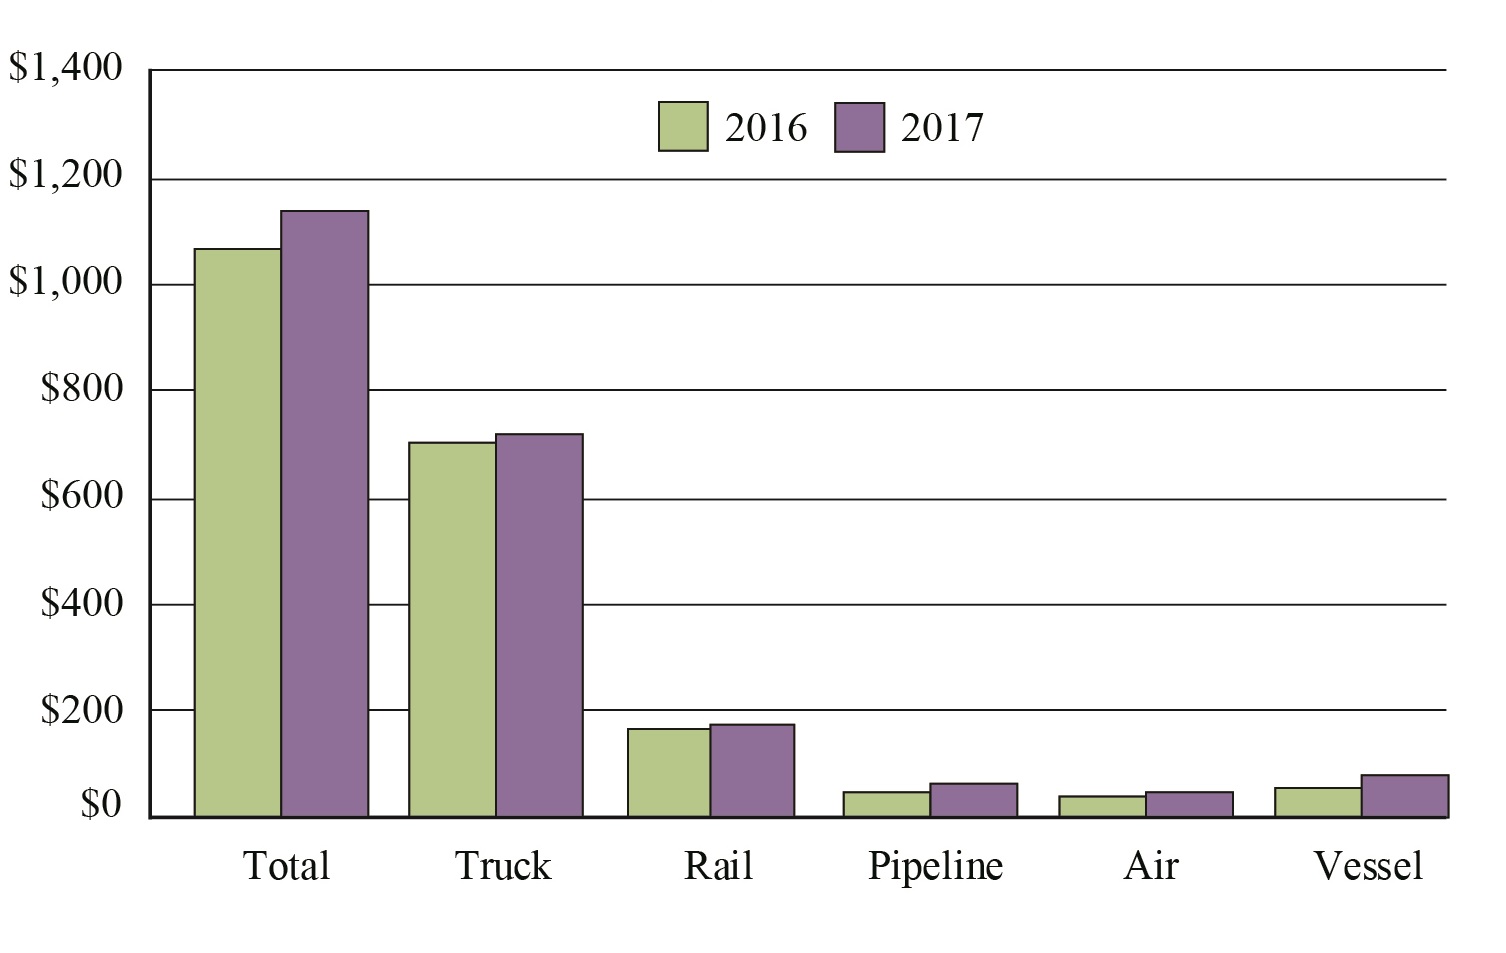
Figure 1: U.S.-North American Freight by Mode: 2016-2017
(billions of current dollars)
Figure

Dataset Table:
| Mode | 2016 | 2017 | Percent Change between 2016-2017 |
|---|---|---|---|
| Truck | 700 | 721 | 3.0 |
| Rail | 166 | 174 | 5.2 |
| Pipeline | 50 | 65 | 31.3 |
| Air | 42 | 44 | 5.3 |
| Vessel | 58 | 76 | 29.6 |
| Total | 1,069 | 1,139 | 6.6 |
Source:
Bureau of Transportation Statistics, TransBorder Freight Data, https://www.bts.gov/transborder as of February 2018.
