
Figure 2. Fares by Airport Group based on Number of Originating Domestic Passengers 2Q 2017
Figure
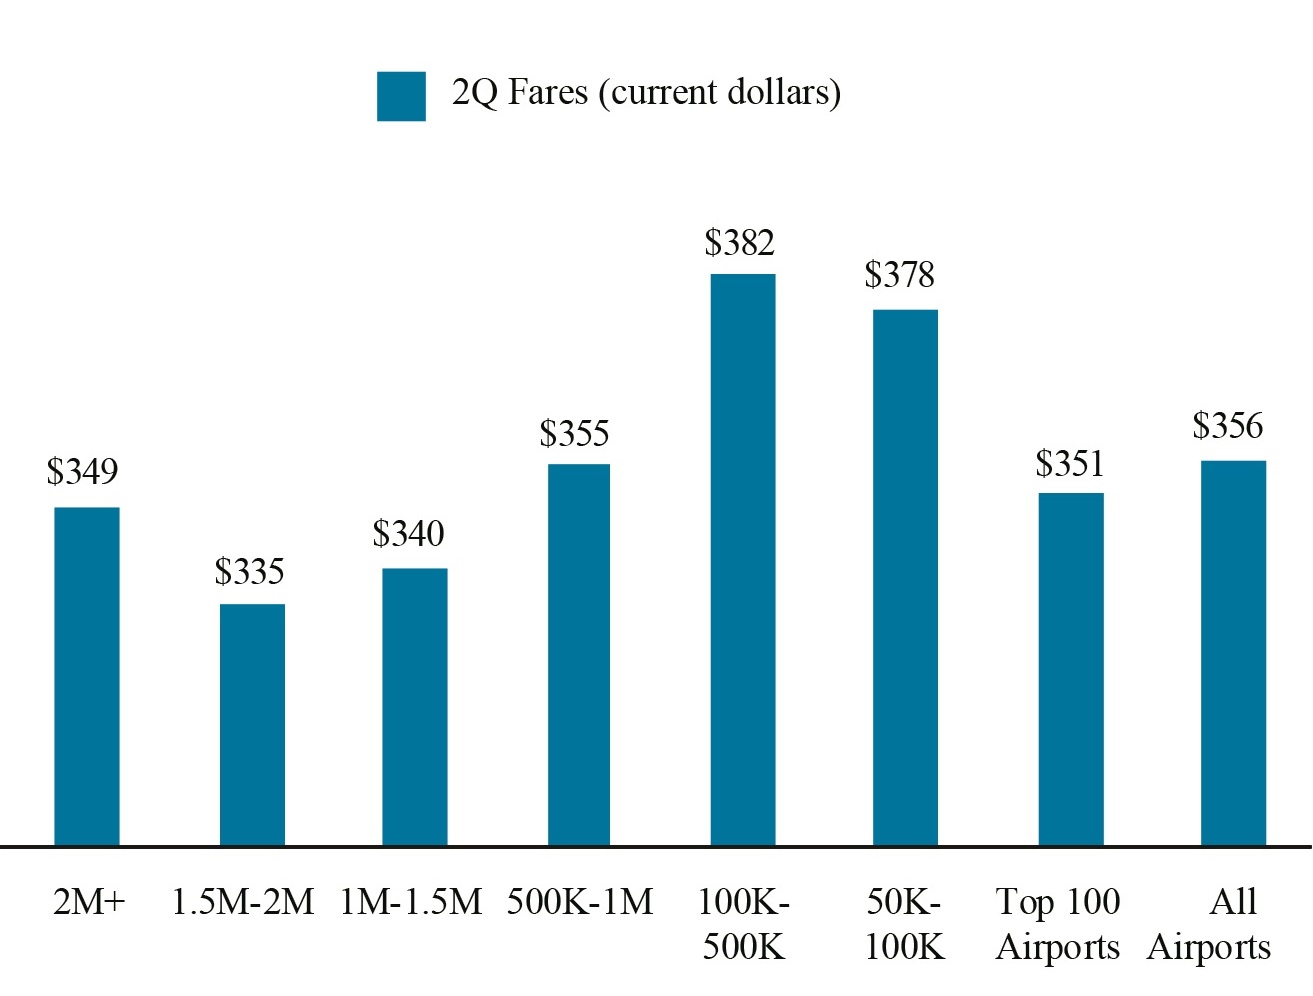
Dataset Table:
| Originating Domestic Passengers | 2Q Fares (current dollars) |
|---|---|
| 2M+ | 349 |
| 1.5M-2M | 335 |
| 1M-1.5M | 340 |
| 500K-1M | 355 |
| 100K-500K | 382 |
| 50K-100K | 378 |
| Top 100 Airports | 351 |
| All Airports | 356 |
Source:
Bureau of Transportation Statistics, Origin and Destination Survey: DB1BTicket