
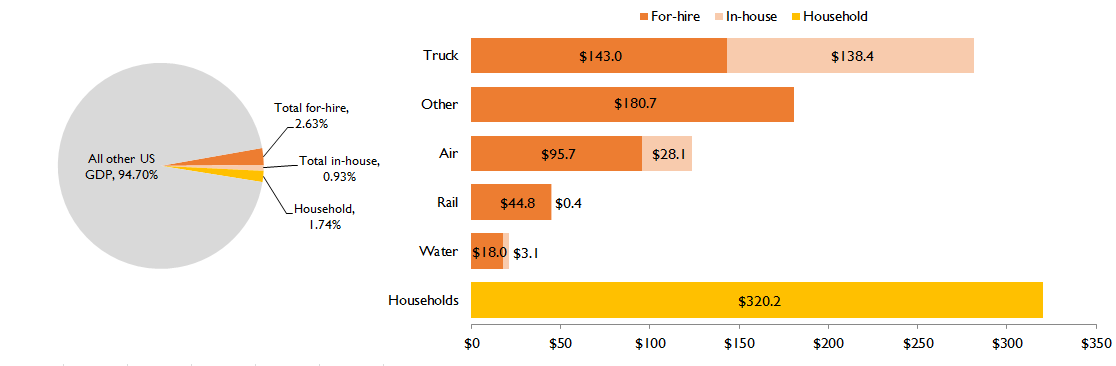
Gross Domestic Product (GDP) Attributed to Transportation Modes (Billions), 2015
In Billions
Figure
Dataset Table:
| Type | Mode | Value-Added | Share of GDP |
|---|---|---|---|
| Household | Households | $320.2 | 1.74% |
| Water | |||
| Rail | |||
| Air | |||
| Other | |||
| Truck | |||
| In-house | Households | ||
| Water | $3.1 | 0.02% | |
| Rail | $0.4 | 0.00% | |
| Air | $28.1 | 0.15% | |
| Other | |||
| Truck | $138.4 | 0.75% | |
| For-hire | Households | ||
| Water | $18.0 | 0.10% | |
| Rail | $44.8 | 0.24% | |
| Air | $95.7 | 0.52% | |
| Other | $180.7 | 0.98% | |
| Truck | $143.0 | 0.78% | |
| Total for-hire | $482.3 | 2.63% | |
| Total in-house | $169.9 | 0.93% | |
| All transportation | $972.4 | 5.30% | |
| GDP | $18,356.8 | 100.00% | |
| All other US GDP | $17,384.4 | 94.70% | |
Source:
U.S. Department of Transportation, Bureau of Transportation Statistics, Transportation Satellite Accounts, available at www.bts.gov