
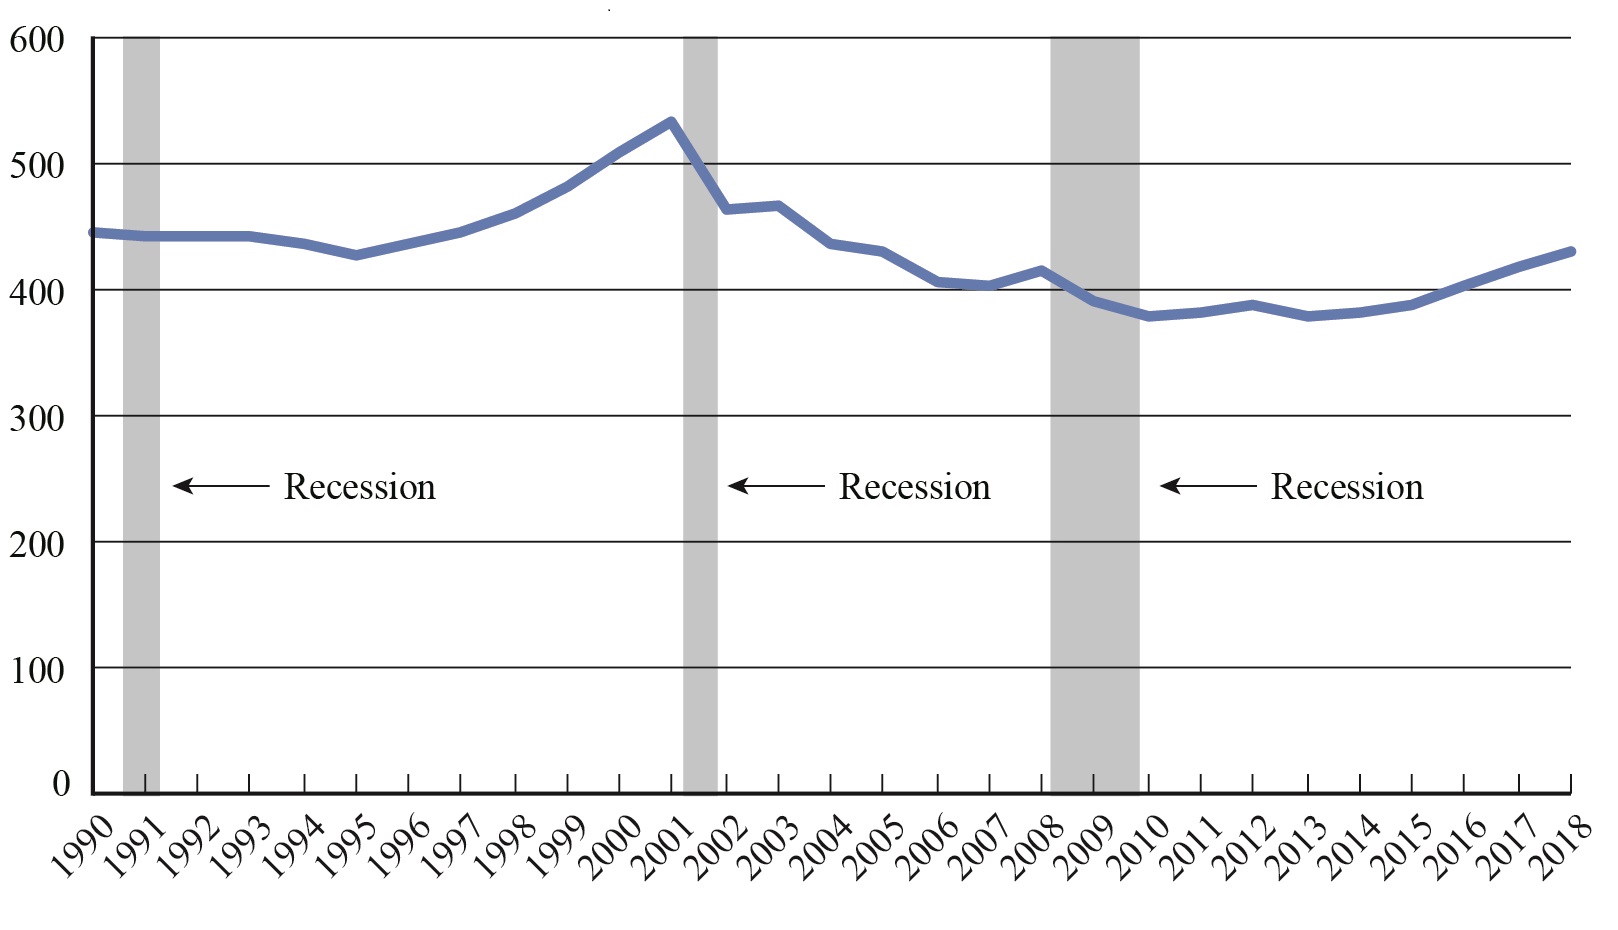
Scheduled Passenger Airline Full-Time Equivalent Employees, Month of January, 1990-2018
January FTEs in thousands (000)
Figure
Dataset Table:
| January FTEs in thousands (000) | |
|---|---|
| 1990 | 444.9 |
| 1991 | 442.6 |
| 1992 | 441.1 |
| 1993 | 441.0 |
| 1994 | 437.5 |
| 1995 | 427.2 |
| 1996 | 435.9 |
| 1997 | 445.7 |
| 1998 | 459.3 |
| 1999 | 482.2 |
| 2000 | 508.5 |
| 2001 | 532.1 |
| 2002 | 464.0 |
| 2003 | 466.9 |
| 2004 | 436.1 |
| 2005 | 430.8 |
| 2006 | 405.2 |
| 2007 | 403.7 |
| 2008 | 415.1 |
| 2009 | 390.6 |
| 2010 | 379.3 |
| 2011 | 381.2 |
| 2012 | 386.4 |
| 2013 | 380.0 |
| 2014 | 381.8 |
| 2015 | 386.5 |
| 2016 | 402.3 |
| 2017 | 417.8 |
| 2018 | 431.3 |
Notes:
Bureau of Transportation Statistics
Source:
FTE calculations count two part-time employees as one full-time employee.