
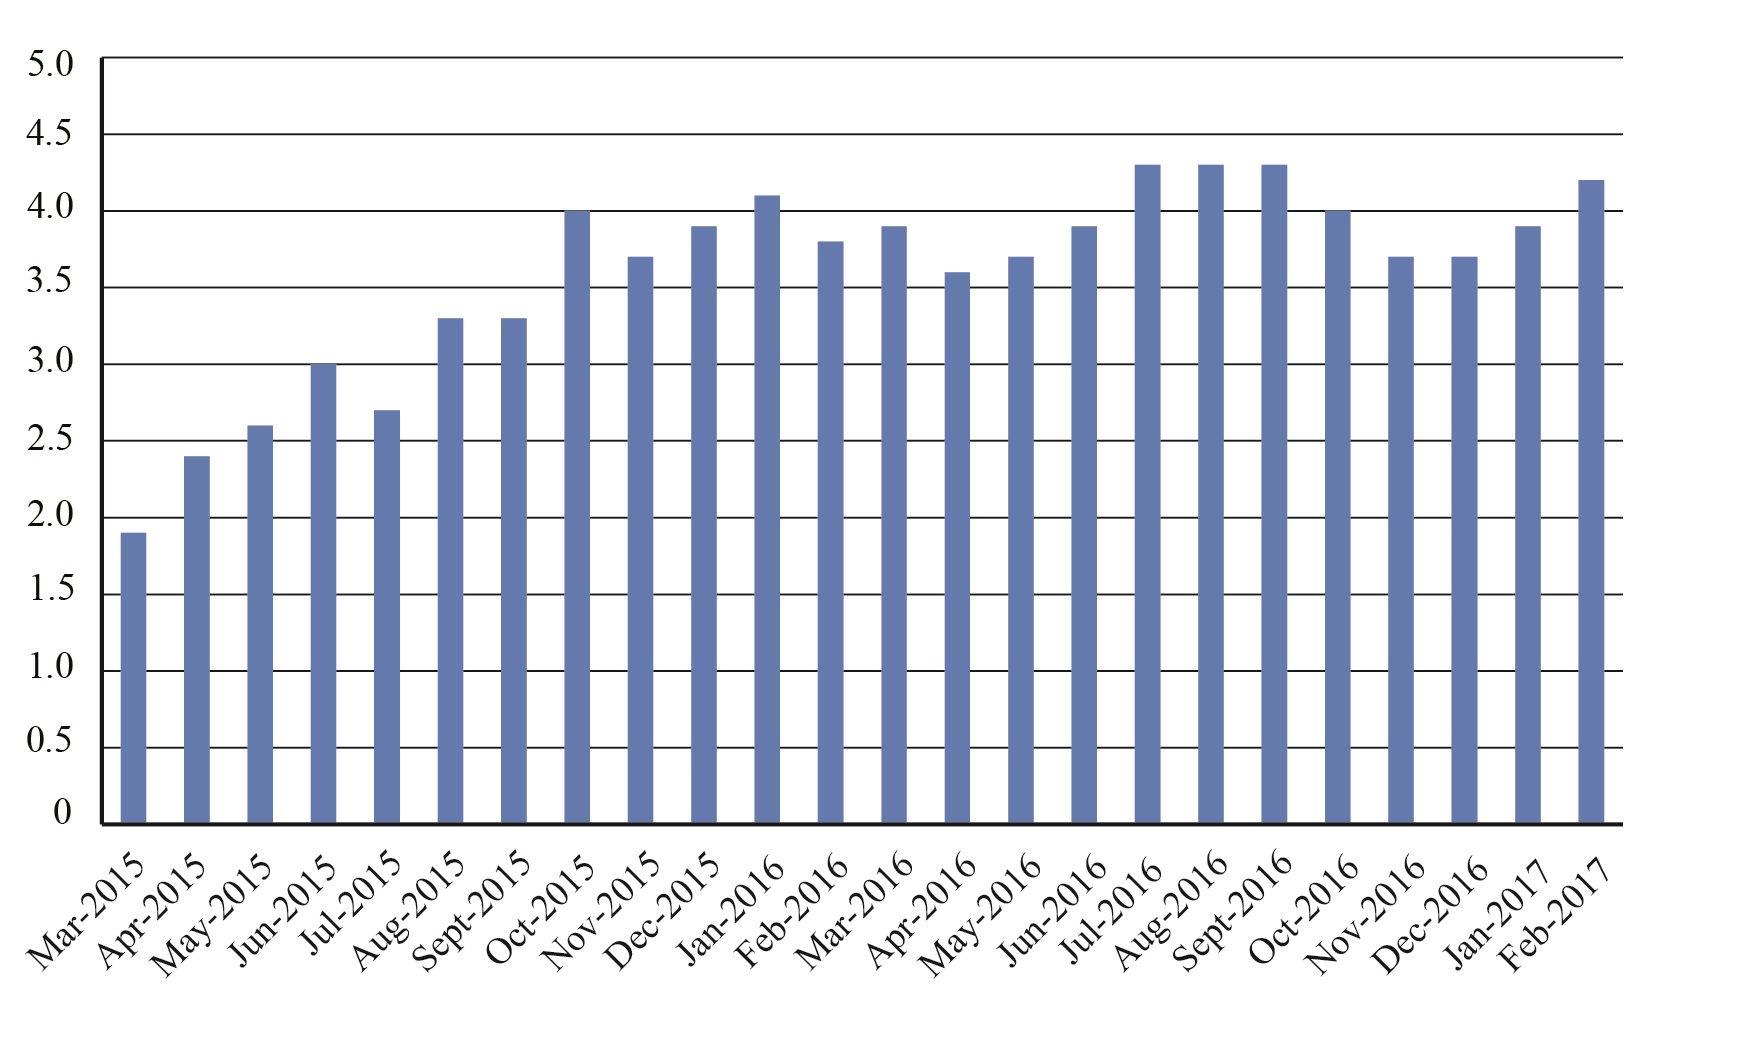
U.S. Scheduled Passenger Airline Employment Percent Change from Previous Year, February 2017
(Last 24 Months)
Figure
Dataset Table:
| U.S. Scheduled Passenger Airline Employment Percent Change from Previous Year (Last 24 months) | |
|---|---|
| 03/2015 | 1.9 |
| 04/2015 | 2.4 |
| 05/2015 | 2.6 |
| 06/2015 | 3.0 |
| 07/2015 | 2.7 |
| 08/2015 | 3.3 |
| 09/2015 | 3.3 |
| 10/2015 | 4.0 |
| 11/2015 | 3.7 |
| 12/2015 | 3.9 |
| 01/2016 | 4.1 |
| 02/2016 | 3.8 |
| 03/2016 | 3.9 |
| 04/2016 | 3.6 |
| 05/2016 | 3.7 |
| 06/2016 | 3.9 |
| 07/2016 | 4.3 |
| 08/2016 | 4.3 |
| 09/2016 | 4.3 |
| 10/2016 | 4.0 |
| 11/2016 | 3.7 |
| 12/2016 | 3.7 |
| 1/2017 | 3.9 |
| 2/2017 | 4.2 |