
Overall Travel Down, Long-Distance Travel Up for Labor Day Weekend as Americans Bid Goodbye to COVID-19 Summer
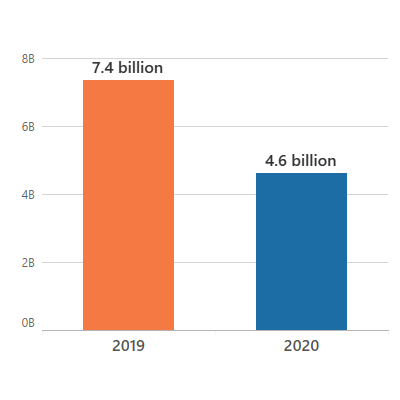
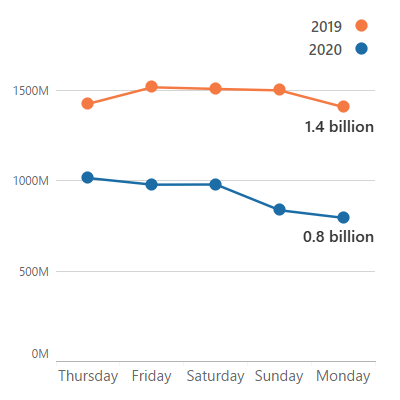
Overall, Americans took 2.8 billion fewer total trips (4.6 billion) during the Labor Day weekend this year than they did in 2019 (7.4 billion). That overall drop of 38% included declines in travel for each day of the 3-day weekend plus the 2 days before the weekend when many people traditionally get a head start on their trips. For both 2019 and 2020, the number of trips was highest on Thursday, Friday and Saturday, with lower numbers on Sunday and Monday.
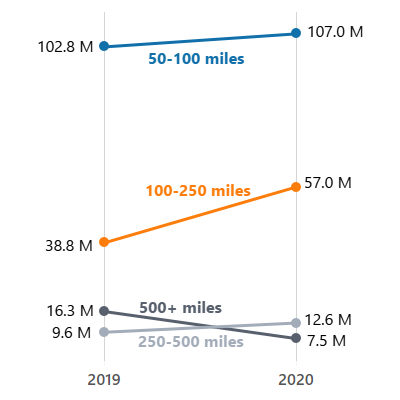
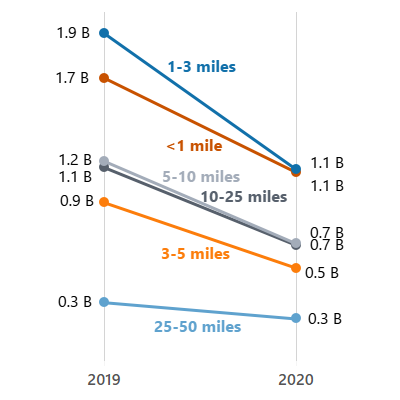
The overall decrease is driven by an equivalent 38% drop (2.7 billion) in the number of local trips (under 50 miles). The number of long-distance trips (50 or more miles), however, increased by 10% (16.6 million) over last year. That long-distance increase was led by a 47% rise (18.2 million) in the number of trips between 100 and 250 miles but muted by a 54% drop (8.8 million) in the number of trips longer than 500 miles.
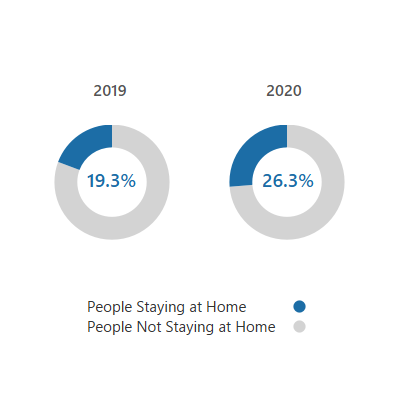
In 2019, on average, 19.3% of Americans stayed home each day during the holiday weekend. In 2020, that number rose to an average of 26.3% staying home each day.
Total Trips
| Total Trips Taken Thursday-Monday During the Labor Day Weekend, 2019 and 2020 | Total Trips Taken Daily Thursday-Monday Labor Day Weekend, 2019 and 2020 |
 |  |
Trips By Distance Grouping
| Total Daily Long-Distance Trips, Labor Day Weekend, 2019 and 2020 | Total Daily Local Trips, Labor Day Weekend, 2019 and 2020 |
 |  |
People Staying Home
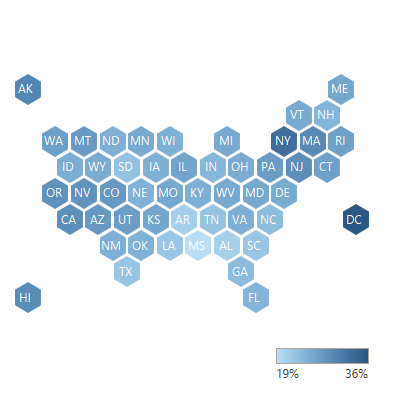
| Daily Percent of People Staying Home, Averaged over the 5-day Labor Day Weekend, 2019 and 2020 | Map of Average Daily Percent of People Staying Home, Labor Day Weekend 2020 |
 |  |
Source:
Data prepared for the Bureau of Transportation Statistics by the Maryland Transportation Institute and Center for Advanced Transportation Technology Laboratory at the University of Maryland from a mobile device data panel from merged multiple data sources. Numbers are subject to change. View this data in detail.
Notes:
These data are experimental and may not meet all of our quality standards. Experimental data products are created using new data sources or methodologies that benefit data users in the absence of other relevant products. We are seeking feedback from data users and stakeholders on the quality and usefulness of these new products. Experimental data products that meet our quality standards and demonstrate sufficient user demand may enter regular production if resources permit.
To explore further, including access to International, National, State, and County-level data, please visit our COVID-19 content.