Potential Effects of a Canadian Rail Disruption
On the morning of August 22, 2024, both of the Class 1 rail carriers in Canada shut down operations. Later that day, the Canadian Government ordered an extension of existing contracts and requested the Canada Industrial Relations Board (CIRB) undertake binding arbitration with railroads and workers. Canadian National operates on 13,785 miles of track, has an annual revenue of CA$17B ($12.5B USD), and has 22,600 employees, while Canadian Pacific Kansas City operates 7,192 miles of track and has a revenue of CA$13B ($10B USD) and 20,000 employees.
Other major railroad carriers have integrated connections with the Canadian rail network, including U.S. Class 1 carriers BNSF Railway, CSX Transportation, Norfolk Southern, and Union Pacific.
Any major Canadian rail disruption has the potential for significant impacts on U.S. freight flows, with the U.S. importing $72 billion and exporting more than $40 billion of goods by rail over the Canadian border. A disruption would likely impact the movement of motorized vehicles, fertilizers, wood products, natural gas, basic chemicals, plastics and rubber, and other goods. Although these commodities represent about 0.5% of all U.S. freight flows, some of these amounts represent a substantial portion of all U.S. trade for that commodity.
For example, trade that crosses the U.S.-Canadian border by rail includes 8.9% of all U.S. fertilizer tonnage, 4.4% of all U.S. metallic ores tonnage, and 2.6% of all U.S. motorized vehicle trade on a value basis.
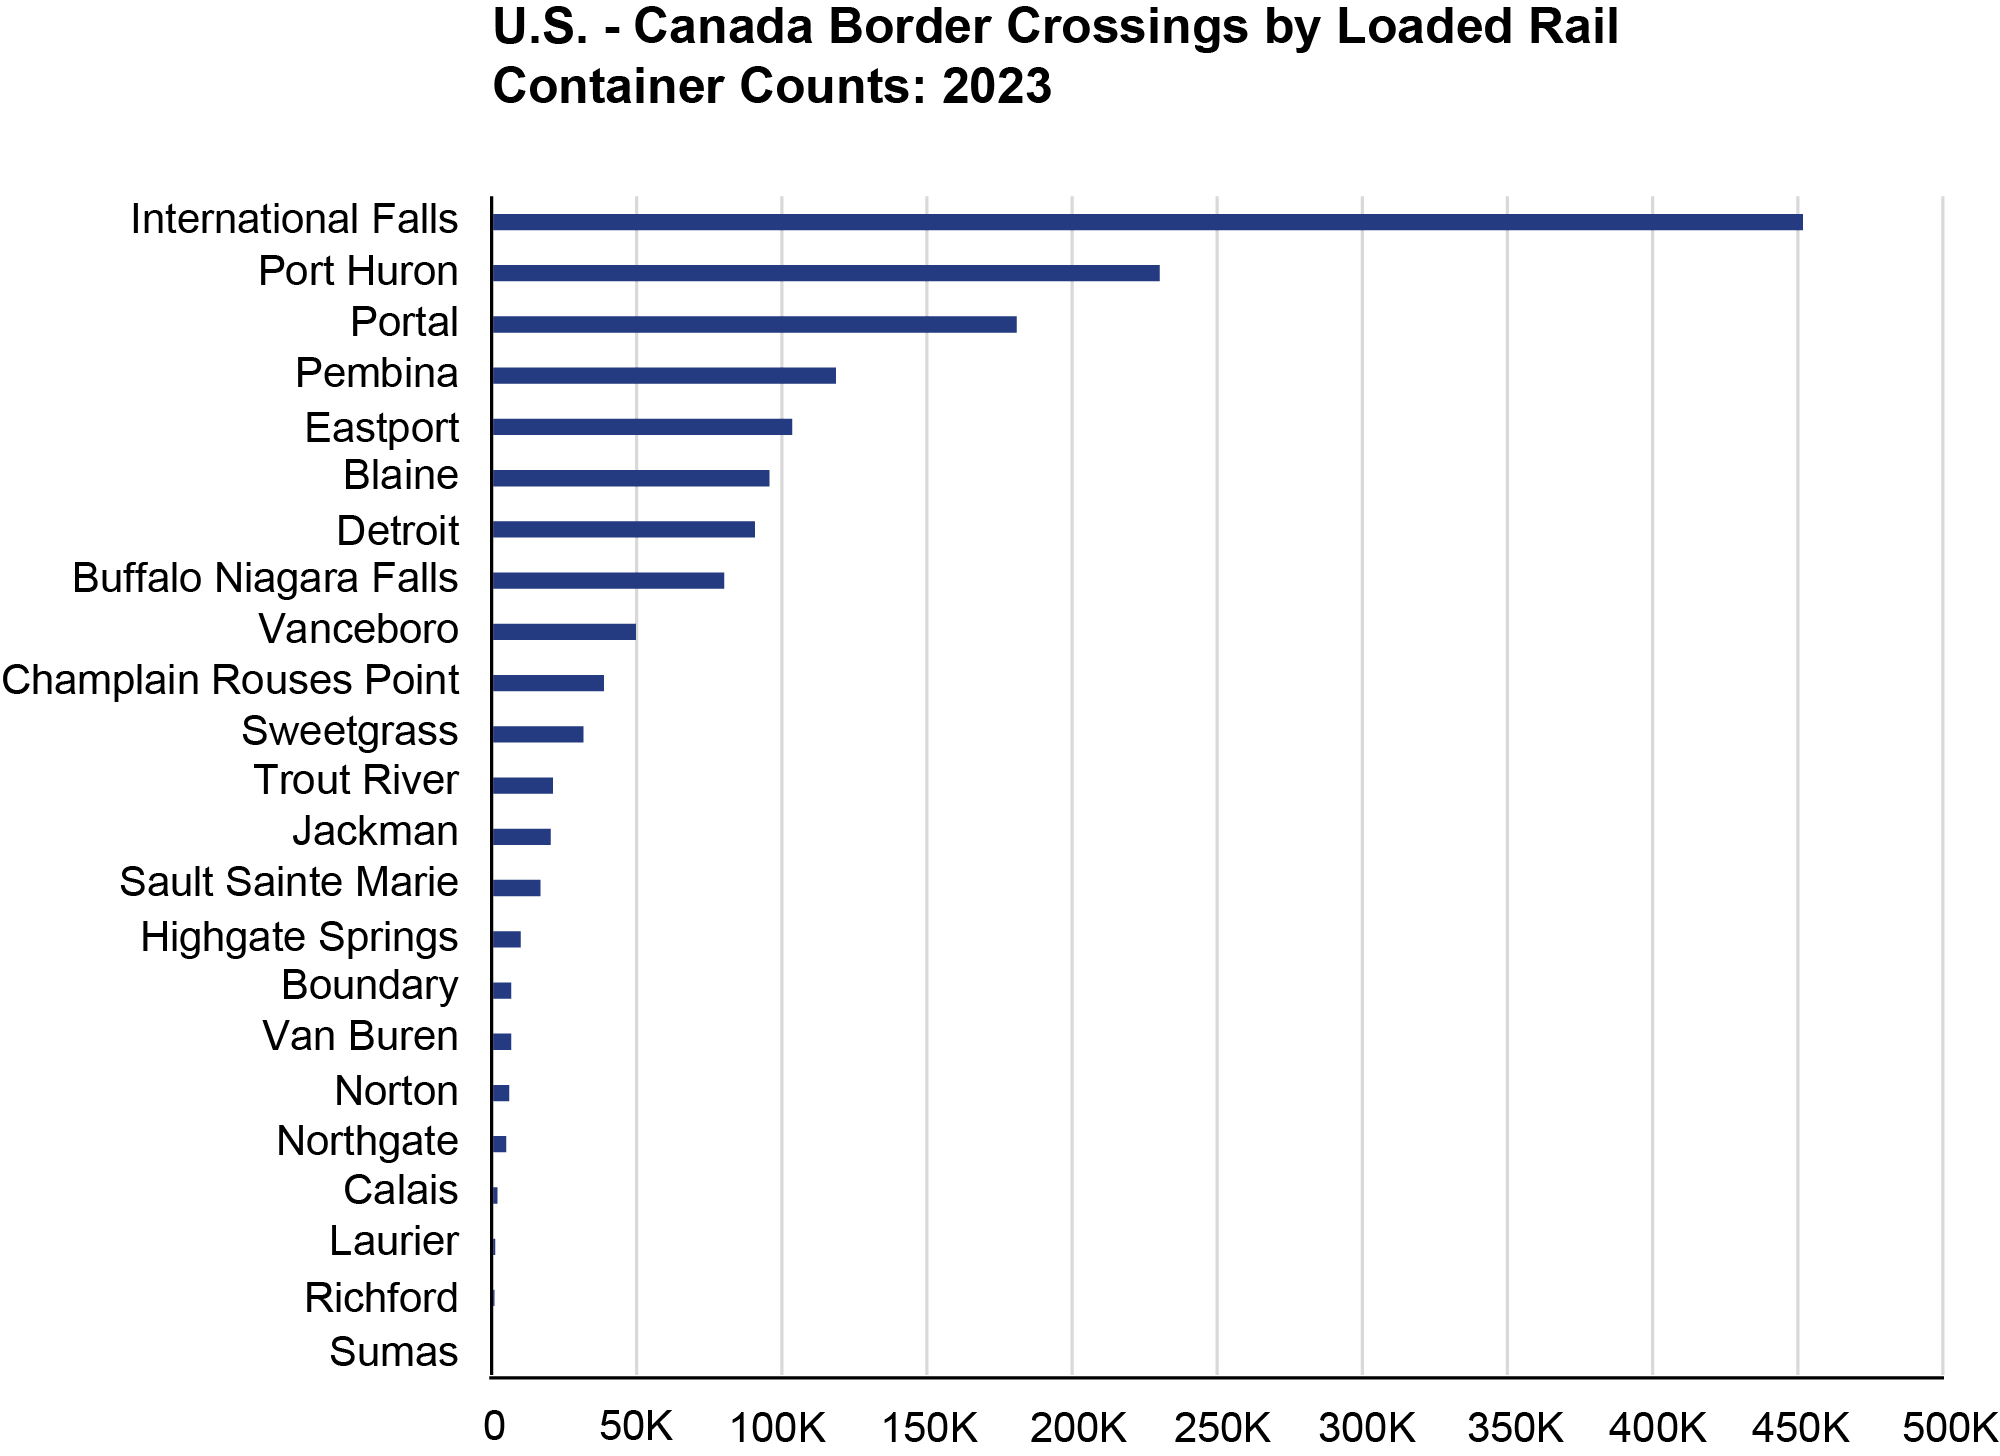
Source: Bureau of Transportation Statistics, Border Crossing/Entry Data, available at https://data.bts.gov/stories/s/jswi-2e7b.
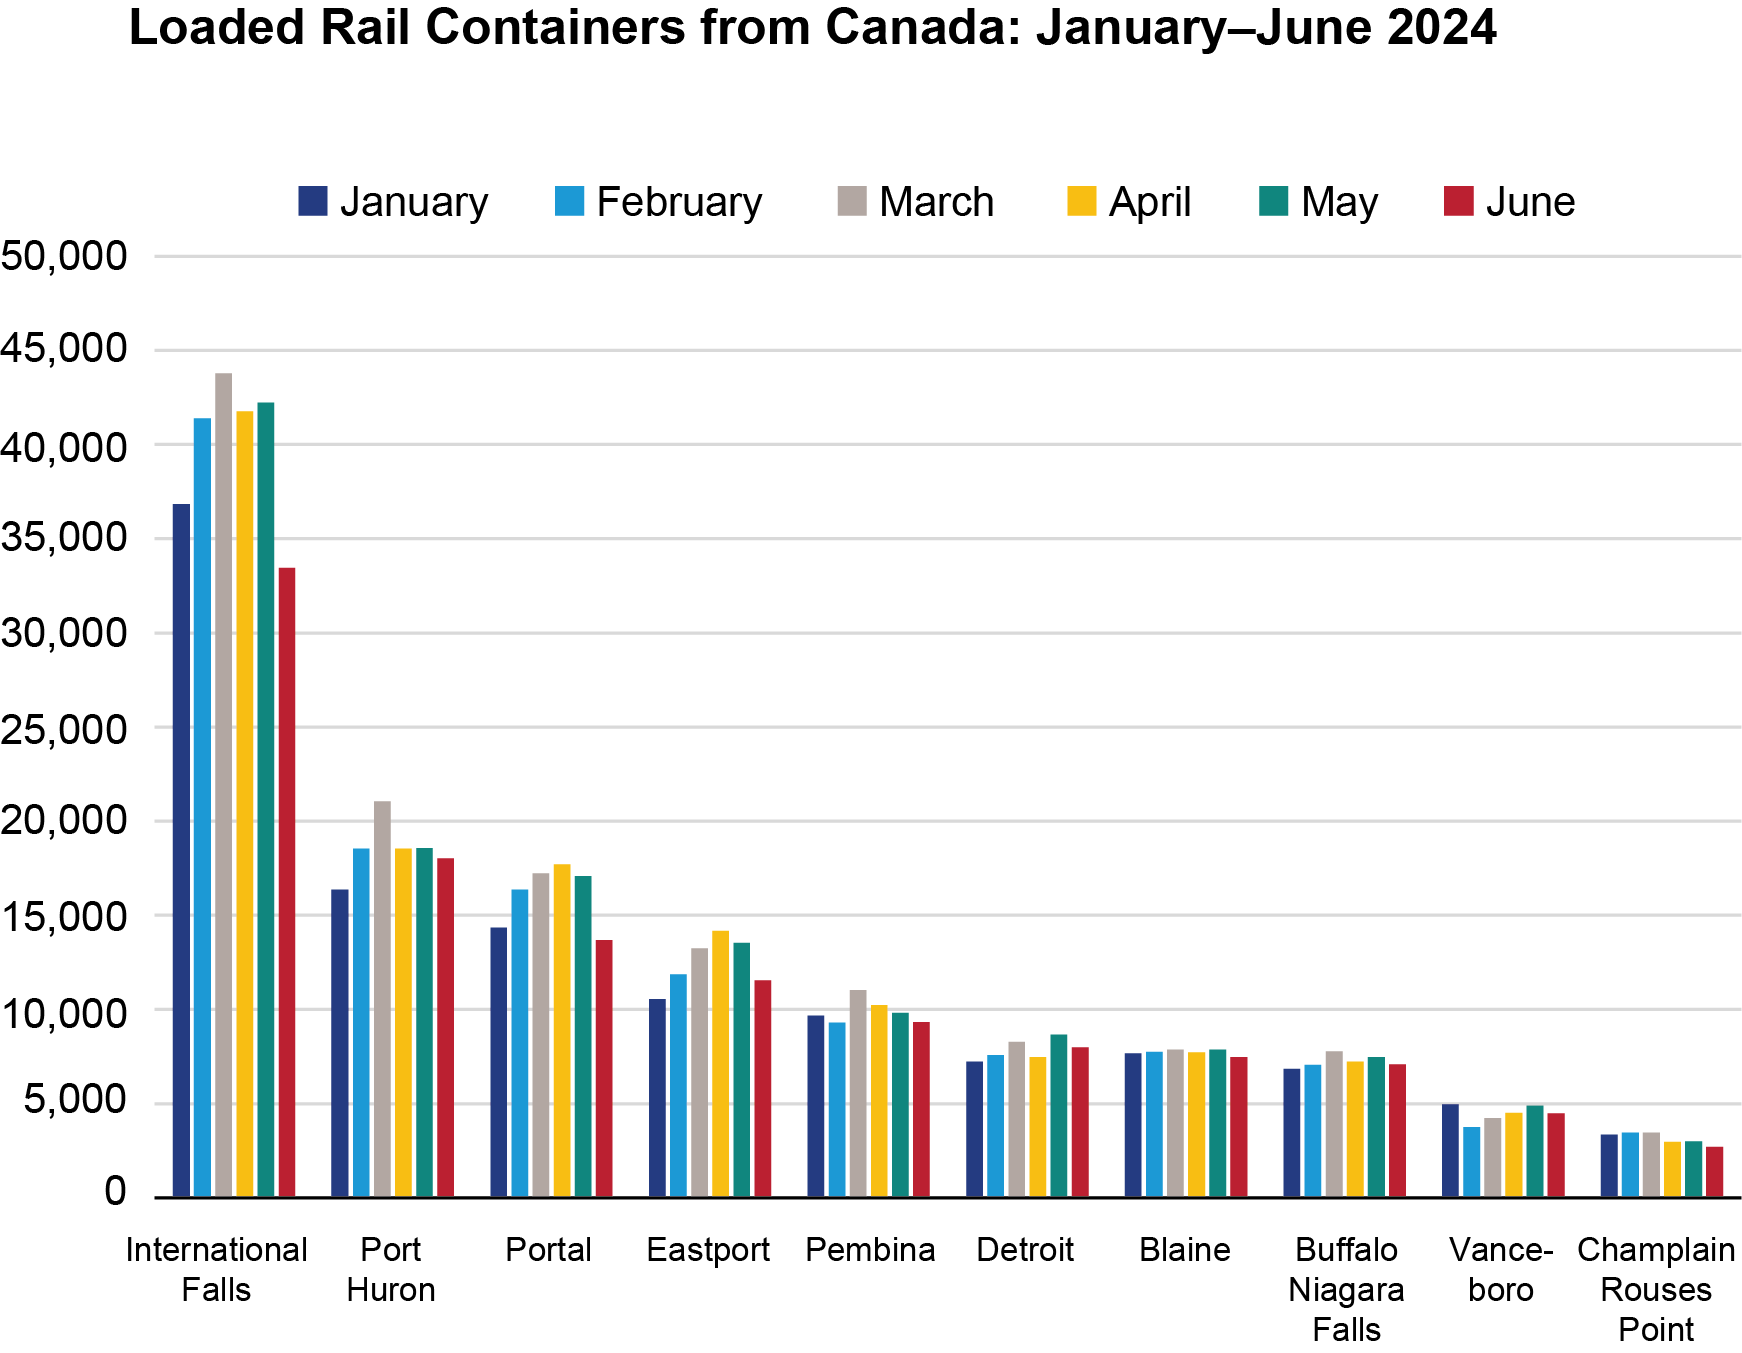
Source: Bureau of Transportation Statistics, Border Crossing/Entry Data, available at https://data.bts.gov/stories/s/jswi-2e7b
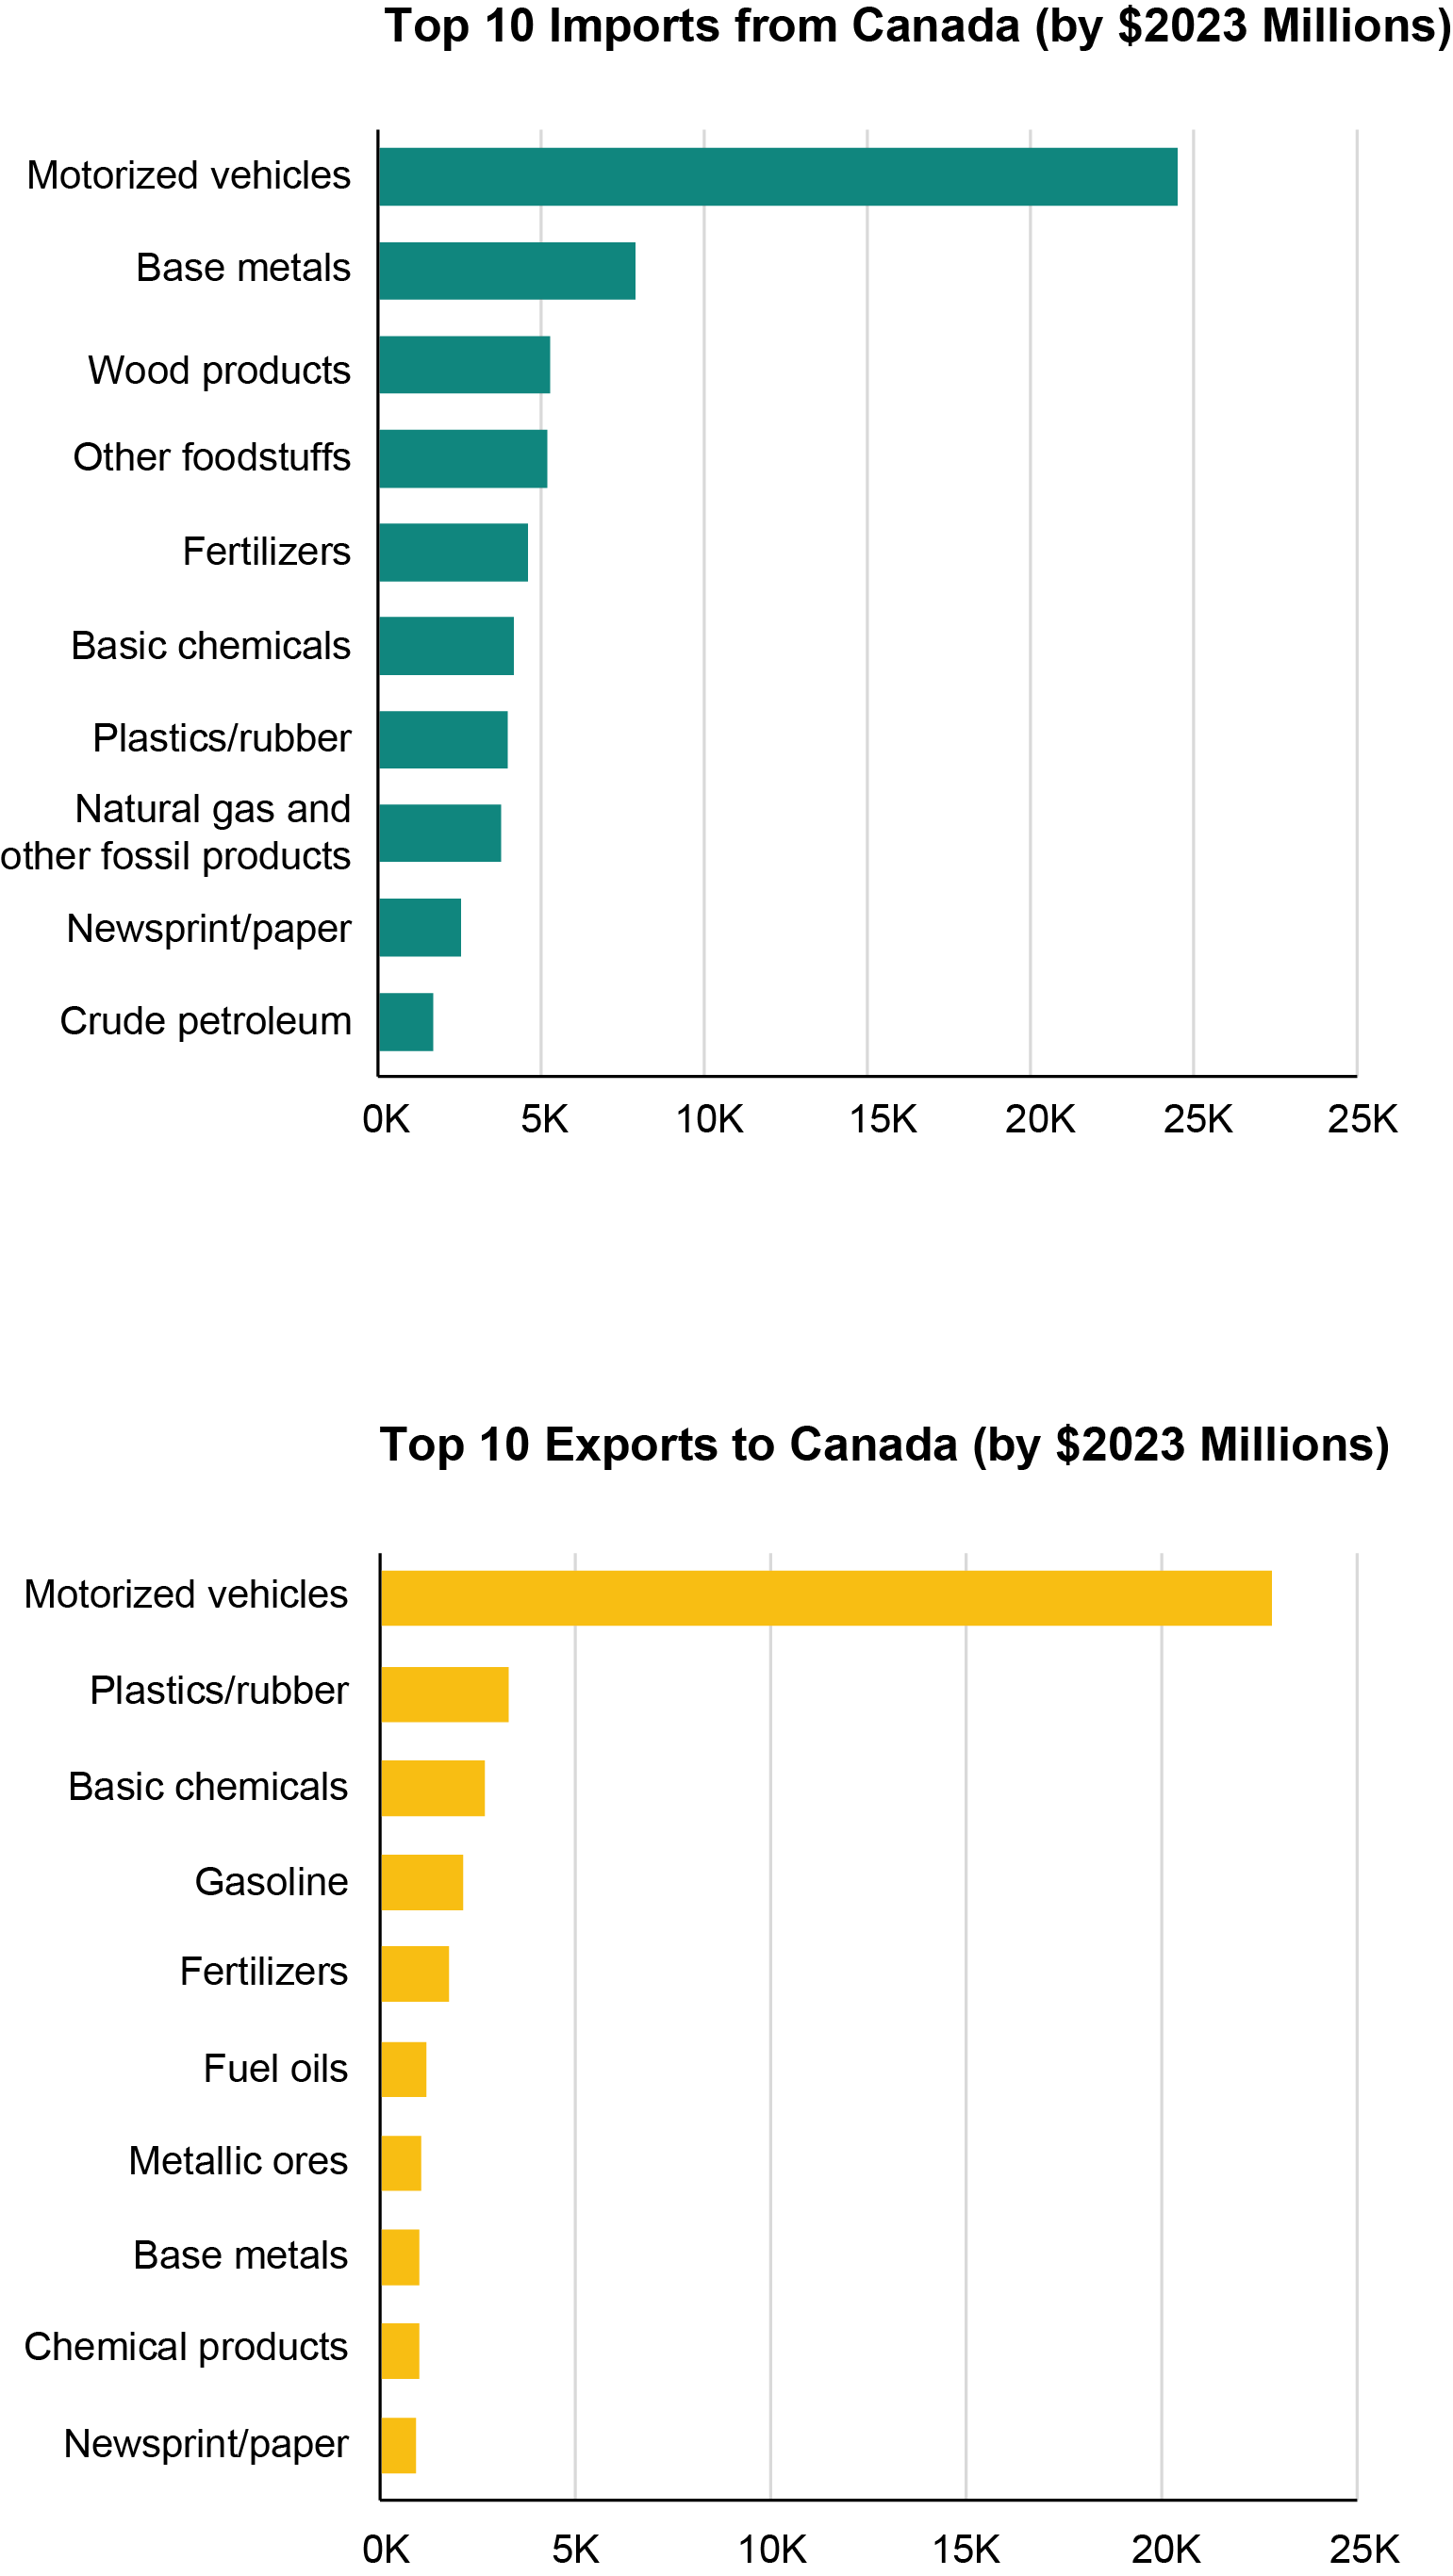
Source: U.S. Department of Transportation, Bureau of Transportation Statistics (BTS), Federal Highway Administration (FHWA). (2017) Freight Analysis Framework, FAF5 [datasets]. FAF 5.6.1, https://www.bts.gov/faf.
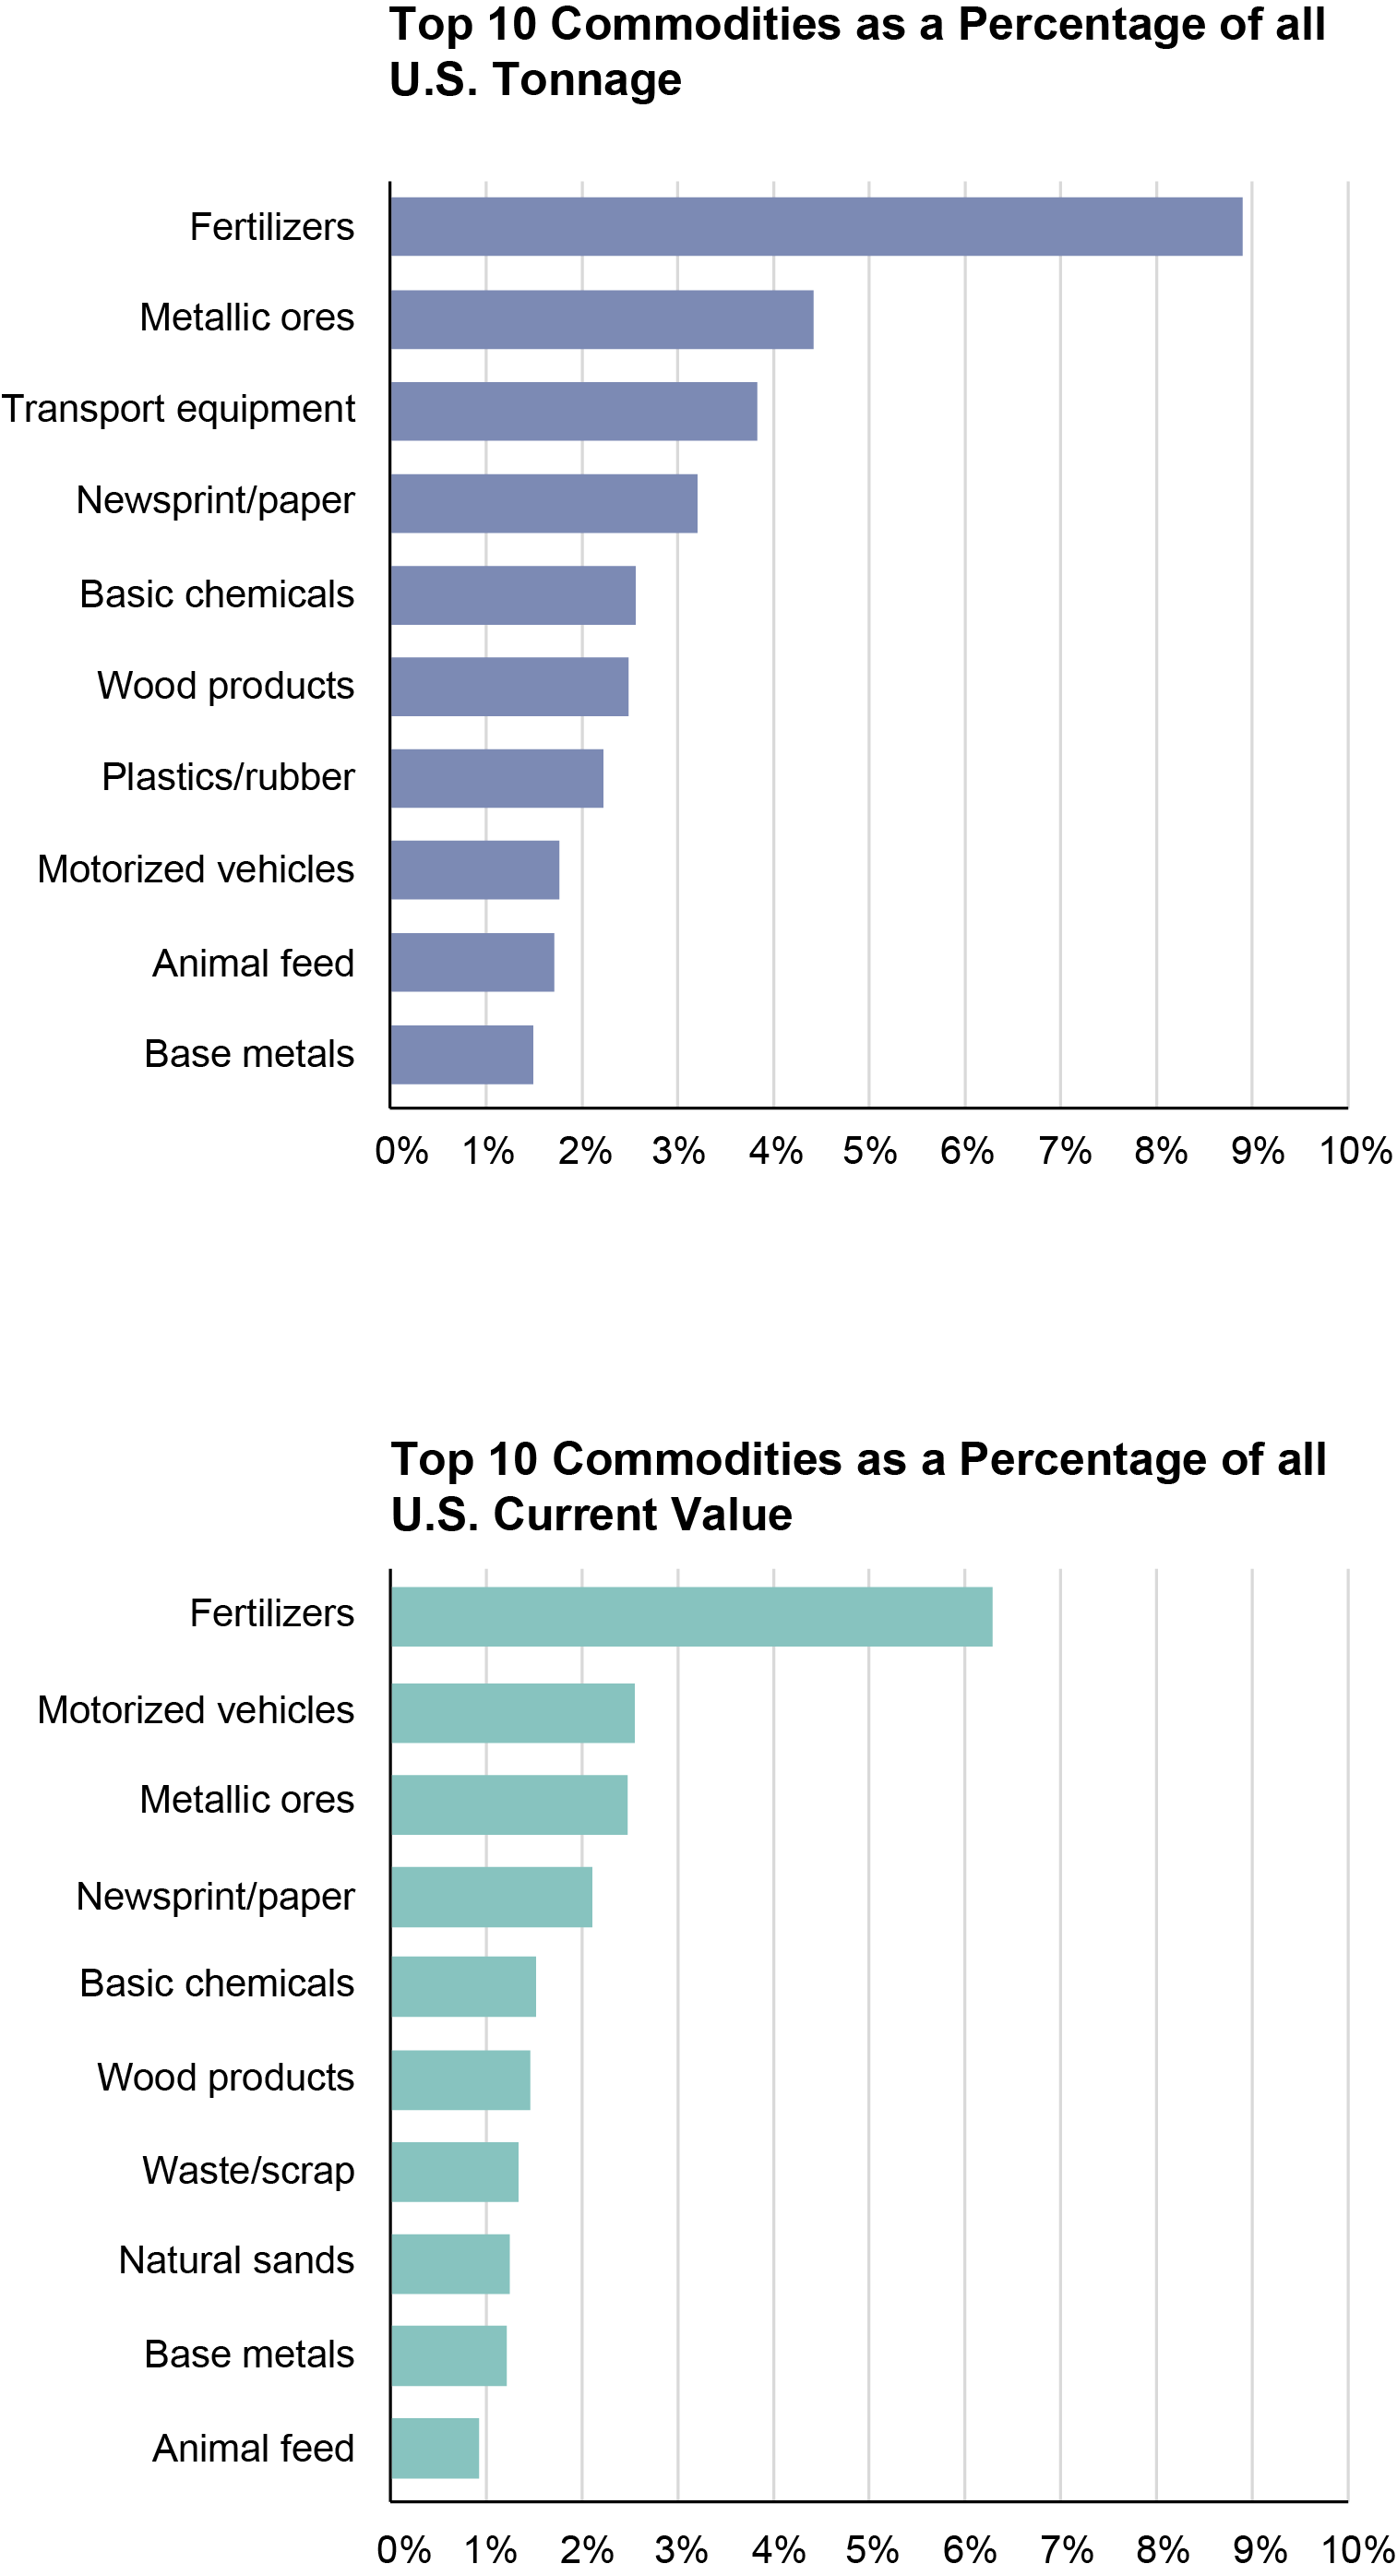
Source: U.S. Department of Transportation, Bureau of Transportation Statistics (BTS), Federal Highway Administration (FHWA). (2017) Freight Analysis Framework, FAF5 [datasets]. FAF 5.6.1, https://www.bts.gov/faf.
BTS will continue to monitor for effects of the impacts of the August 22 shutdown, as the volume of trains and containers crossing the U.S.-Canada border may take several days to return as operations resume. In 2023, U.S. freight flows by rail with Canada totaled $113.9 billion or 15% share of all modes. That was $41.6 billion in exports and $72.2 billion in imports traveling on 1,571,503 incoming loaded rail containers. In terms of weight, total U.S. – Canada freight flows by all modes of transportation was 448.2 million tons in 2023. Rail moved 82.1 million tons or 20% of those imports in 2023 (export weights are not available for rail).
Take a closer look at the map below.
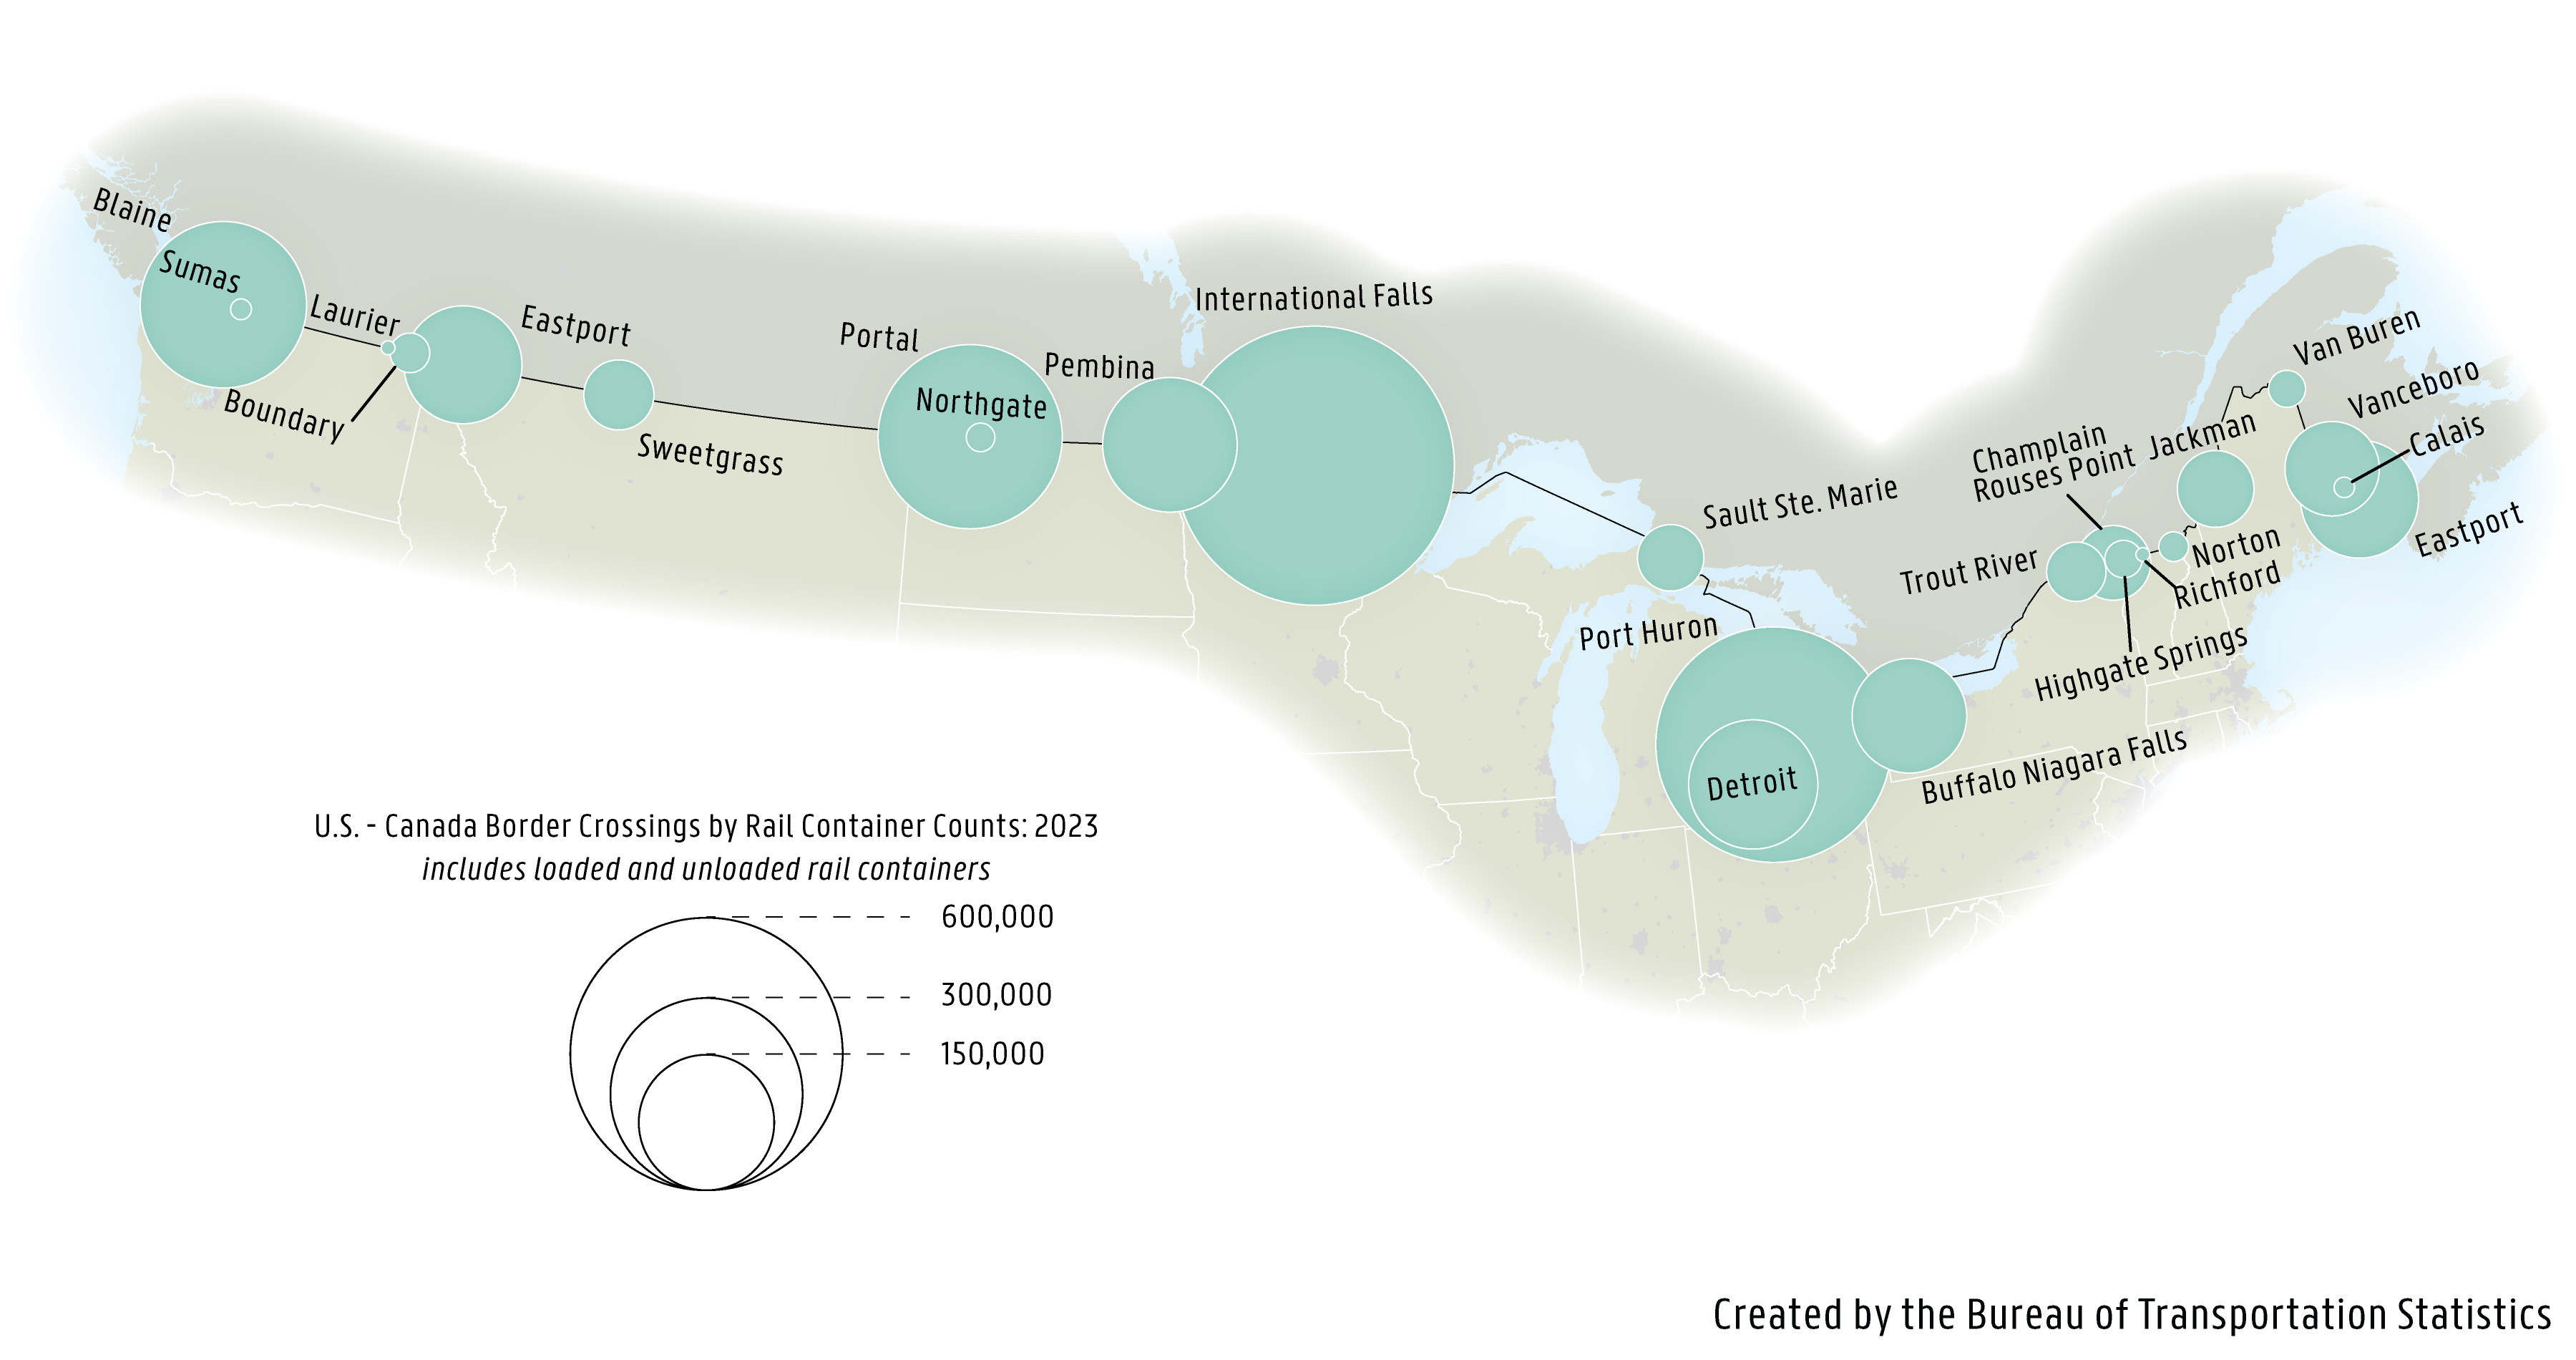 Source: U.S. Department of Transportation, Bureau of Transportation Statistics, Border Crossing Entry Data 2023.
