BTS Freight Transportation Services Index Increases for Third Consecutive Month; What’s a Freight Transportation Services Index?
Data spotlights represent data and statistics from a specific period of time, and do not reflect ongoing data collection. As individual spotlights are static stories, they are not subject to the Bureau of Transportation Statistics (BTS) web standards and may not be updated after their publication date. Please contact BTS to request updated information.
Freight is an important part of the U.S. economy. In 2017, the most recent year of available data, American manufacturers, wholesalers, and other industries shipped nearly 12.5 billion tons of goods with a total value of more than $14.5 trillion. The Freight Transportation Services Index (Freight TSI) is a measure of the amount of freight carried by the transportation industry.
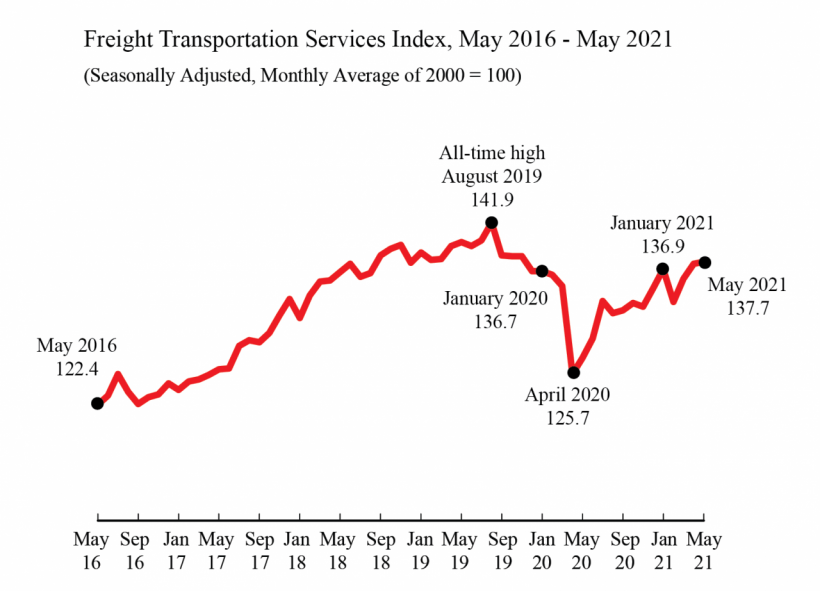
In May 2021, the value of the Freight TSI inched up 0.1% from April, its third increase in a row. But, what does that really mean, and why does BTS produce the Freight TSI?

Freight is a bellwether of economic activity; that makes the Freight TSI an economic indicator.
Let’s start with the basics. Freight is the stuff that gets shipped when industries have raw materials and intermediate goods delivered to them and when they deliver finished products to stores and consumers. We call this flow of goods the supply chain. The BTS Freight TSI combines monthly estimates of freight being moved by for-hire trucking, the number of rail carloads carrying freight, and other measures of freight activity into a single number reflecting how busy the U.S. supply chain is.
NOTE: “For-hire” trucking refers to services contracted by a shipper, as opposed to “in-house” truck fleets that are part of the companies they transport for.
Shipments of raw materials and intermediate goods occur before consumers and other businesses buy the products made from them. So, freight activity is seen as an early indicator of economic growth or decline. When more freight is being shipped, that generally means economic activity will be increasing. When less freight is demanded, that points to decreasing economic activity.
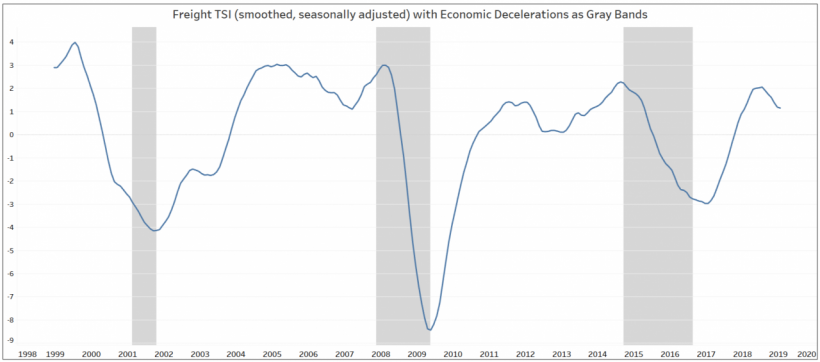
We have found that, even while the economy is still growing, a change in the Freight TSI can indicate future changes in the economy’s growth rate. When the economy is declining or growing at slower rates than in previous months, we call that a “deceleration.” The chart below shows how changes in the Freight TSI (blue line) generally precede economic decelerations (gray bars).
How does the BTS Freight TSI stack up against other freight measures?
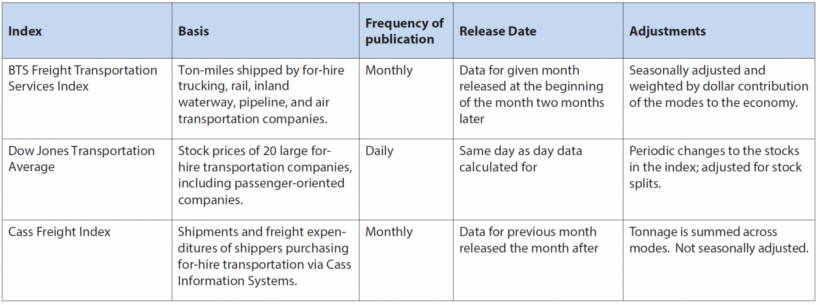
The Freight TSI includes data from trucking, rail, inland waterways, pipelines, and air cargo. BTS weights output by each mode of transportation’s dollar-contribution to the economy. This recognizes that some ton-miles are a bigger deal economically than other ton-miles. For example, it generally costs more to ship freight by air, so a ton of air cargo has a different economic impact from a ton of freight shipped by train. The Freight TSI is also adjusted to remove regular seasonal variation from the month-to-month comparisons.
So, the TSI:
- Combines freight activity across different modes of transportation into a single indicator;
- Takes into account the extent of individual mode’s contribution to the economy; and
- Adjusts for seasonality.
For example, in May 2021, the Freight TSI increased because of seasonally-adjusted increases in rail carloads, air freight, truck, and maritime, and despite declines in rail intermodal and pipelines.
The Cass Freight Index and the Dow Jones Transportation Average (DJTA) are two other freight measures commonly cited as economic indicators.

Cass looks at shipments and expenditures of shippers purchasing freight transportation through the Cass payment processing system. Cass also produces two separate indices, one for shipment volumes and one for expenditures. For some industry analysts, the two different Cass measures provide useful depth. Cass sums tonnage across modes; does not adjust for seasonality; and includes information on a shipment in the month when it is contracted, not when it is shipped.
The DJTA is an index of the stock prices of 20 different publicly traded transportation corporations. It does not measure shipment activity; it’s an indicator of how investors value the transportation industry. For some analysts, that can be a useful perspective. Because the DJTA includes some passenger transportation companies, it’s a transportation index but not a freight index. (BTS also publishes a Passenger TSI and a Combined TSI.)
So, how does the Freight TSI stack up? We think it holds its own, and many experts agree. However, many industry analysts use several indices for a more complete economic picture.
Ready to learn more about the TSI?
- Transportation as an Economic Indicator: Transportation Economic Concepts
- Transportation as an Economic Indicator: Transportation Services Index
- What the Transportation Services Index, Dow Transportation Index, and Cass Freight Index Tell Us
- Transportation Services Index and the Economy-Revisited

