
COVID-19 Pandemic Drops 2020 Household Spending on Transportation by Nearly 14%
Data spotlights represent data and statistics from a specific period of time, and do not reflect ongoing data collection. As individual spotlights are static stories, they are not subject to the Bureau of Transportation Statistics (BTS) web standards and may not be updated after their publication date. Please contact BTS to request updated information.
Average household transportation spending decreases to $9,465 from $10,960
With the onset of the COVID-19 pandemic in early 2020 and the arrival of lockdowns and other protective measures, household spending on transportation declined 13.6% from 2019 to 2020. As Americans drove fewer commutes and took fewer trips, the average U.S. household spent $9,645 moving around in their everyday lives in 2020, dropping from $10,960 in 2019. These changes and others are explored in the recently updated BTS Total National Household Spending on Transportation page.
Overall household transportation spending fell to $1.2 trillion in 2020 from 2019's $1.4 trillion. This year-over-year decline (not adjusted for inflation) is similar in magnitude to the drop in 2009 during the economic recession and mirrors the disruptions in passenger travel by all modes of transportation during the pandemic.
Year-Over-Year Percent Change in National Household Spending on Transportation
![]()
NOTE: Household spending figures include spending by governments, employers, and other organizations on behalf of households—for example, employee transit subsidies.
SOURCE: BTS analysis of Bureau of Economic Analysis, Consumer Spending Data, https://www.bea.gov/data/consumer-spending/main
Total spending by American households decreased 2.6 percent in 2020 from 2019, and transportation spending dropped by a far greater percentage than any other category. That said, transportation remained the fourth largest household expenditure category. In 2020, spending on transportation accounted for 8.7% of total national household spending, down from 9.8% in 2019.
|
Average National Household Spending (Major Spending Categories) |
|||||
|
Thousands of current dollars |
Percent Change |
Share of total spending |
|||
|
Category |
2019 |
2020 |
2019 |
2020 |
|
|
Total spending |
112.2 |
109.4 |
-2.5 |
||
|
Other spending |
26.7 |
26.7 |
0 |
23.8 |
24.4 |
|
Health |
23.9 |
23.0 |
-3.8 |
21.3 |
21.0 |
|
Housing |
20.2 |
20.9 |
3.7 |
18.0 |
19.1 |
|
Food |
13.3 |
13.1 |
-1.6 |
11.9 |
12.0 |
|
Transportation |
11.0 |
9.5 |
-13.6 |
9.8 |
8.7 |
|
Recreation |
9.8 |
9.2 |
-6.6 |
8.7 |
8.4 |
|
Financial Services and Insurance |
4.1 |
4.1 |
0 |
3.7 |
3.8 |
|
Apparel and related services |
3.2 |
2.9 |
-9.0 |
2.9 |
2.7 |
SOURCE: BTS analysis of Bureau of Economic Analysis, Consumer Spending Data, https://www.bea.gov/data/consumer-spending/main
Spending on public transportation drops nearly 60%
Household spending on transportation includes these categories: motor vehicles; motor vehicle parts and services; motor vehicle fuels, lubricants, and fluids; motor vehicle and other transportation insurance; and public forms of transportation (e.g., passenger air fares, transit costs, rail travel, etc.).
Spending on public transportation decreased the most at 56.0%, with several modes incurring steep declines:
- Ground and passenger transportation (e.g., rail, intercity bus, taxi, transit, etc.) by 50.1%
- Air transportation by 58.7%
- Water transportation (e.g. ferry) 61.2%
Personal vehicle spending also plunges
Spending on motor vehicle fuels, lubricants, and fluids declined by the second largest amount at 27.8% followed by spending on motor vehicle parts and services (6.7% decline), motor vehicles (5.5% decline), and motor vehicle insurance (0.8% decline).
Spending on bicycles and bike accessories bucks the norm, rising 18%
Not all spending on transportation goods and services declined in 2020. Household spending on bicycles and bike accessories increased by 18.0% from 2019 to 2020 (not adjusted for inflation).
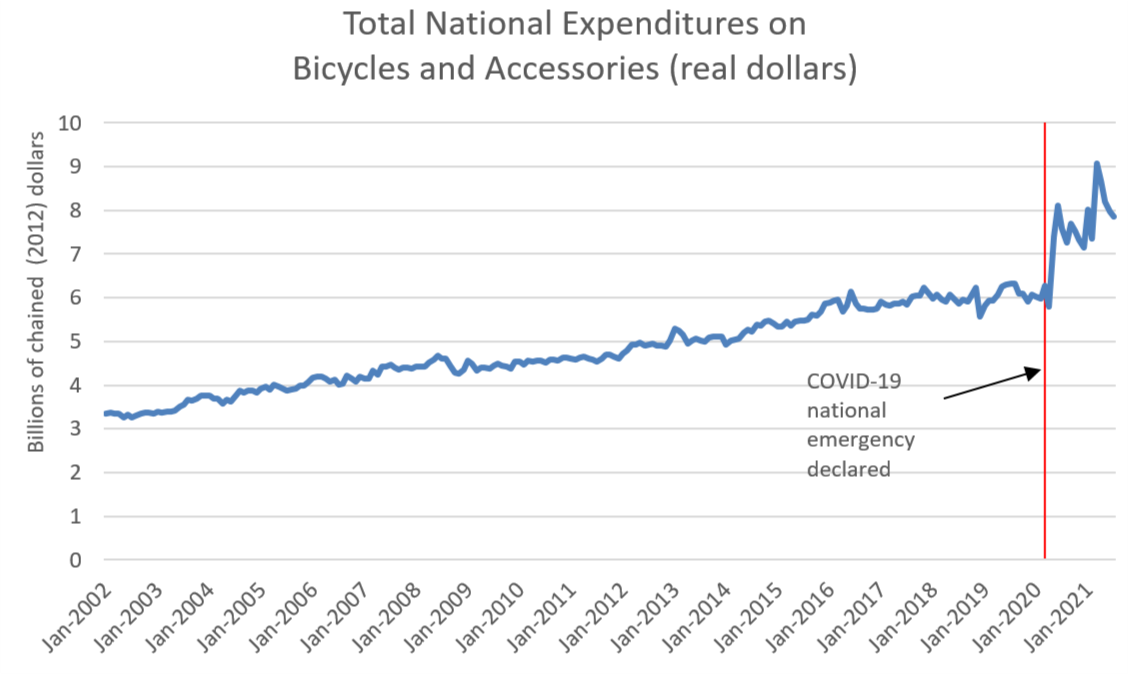
NOTE: Spending on bicycles and bike accessories is counted as Recreation in the data.
SOURCE: BTS analysis of Bureau of Economic Analysis, Consumer Spending Data, https://www.bea.gov/data/consumer-spending/main
As the chart above shows, the largest increase in spending on bicycles and accessories, at 27.7%, occurred in May 2020, when many states began gradual re-opening after issuing COVID-19 stay-at-home measures. The second largest increase occurred in March 2021 (23.4%) as spring returned.
Take a deeper dive into household spending on transportation and other goods and services
Curious about total and average household spending on transportation and transportation's contribution to the U.S. economy? There's no better place to start than on the BTS series Transportation Economic Trends and its Household Spending on Transportation page.