
Data Spotlight: Navigation Channel Bridges at Top-Ranking Ports
Data spotlights represent data and statistics from a specific period of time, and do not reflect ongoing data collection. As individual spotlights are static stories, they are not subject to the Bureau of Transportation Statistics (BTS) web standards and may not be updated after their publication date. Please contact BTS to request updated information.
Navigation channel bridges associated with highway and maritime transportation provide passage for vehicles to cross waterways, they also limit a port's ability to accommodate growing vessel sizes due to vertical clearances. As a result, an inoperative or collapsed channel bridge can impact the U.S. supply chain and freight movement. Therefore, it is essential to assess the current conditions of bridges crossing navigation channels to ensure transportation safety and resiliency.
Based on the 2025 Port Performance Annual Report, 47 ports appeared in the top 25 for tonnage, dry bulk, and container (twenty-foot equivalent units, or TEUs). This study focuses on the navigation channel bridges at the six ports that ranked in the top 25 across all three categories:
- Port of Baltimore, Maryland
- Port of Virginia, Virginia
- Port of Mobile, Alabama
- Port of New Orleans, Louisiana
- Port of Houston, Texas
- Port of Long Beach, California
A total of eleven bridges were identified and evaluated for their overall condition, air draft, age, average daily traffic (ADT), and detour miles if these bridges were to be closed. Of these, five bridges at the Port of New Orleans and Port of Houston are on the National Transportation Safety Board (NTSB) list of 67 U.S. bridges over navigable waterways frequented by ocean-going vessels with unknown levels of risk of collapse from a vessel collision (Table 1). This was part of NTSB’s investigation into the Francis Scott Key Bridge collapse, which exceeded the acceptable risk threshold by nearly 30 times and was primarily due to the bridge's conditions and design, despite a collision with the containership Dali. (National Transportation Safety Board 2025).
Figure 1. Six Top-Ranking Ports with Navigation Channel Bridges
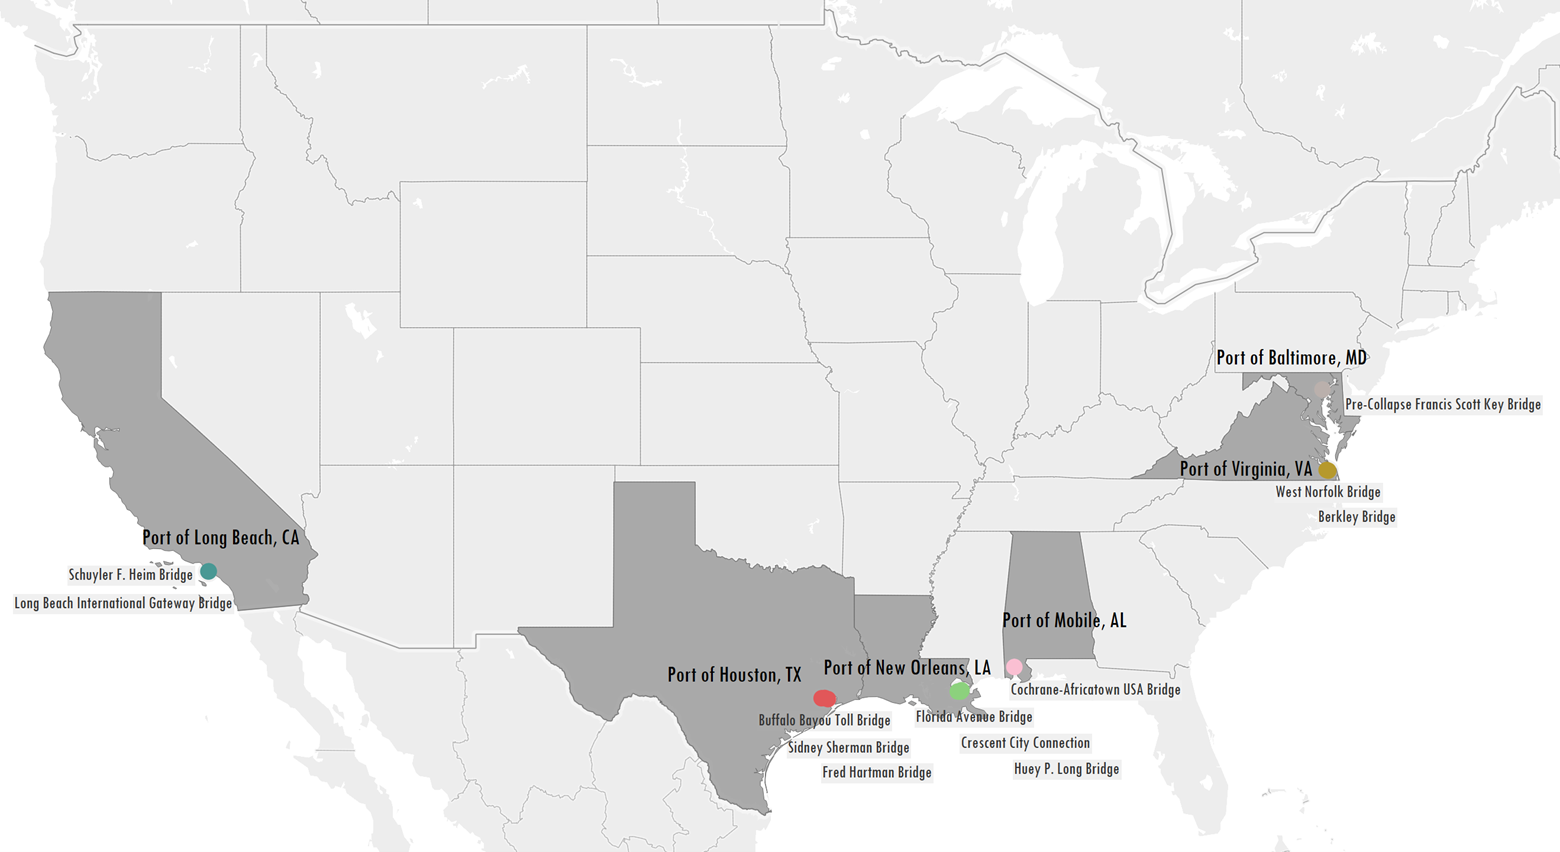
Source: U.S. Department of Transportation, Bureau of Transportation Statistics.
A bridge’s overall condition is determined by the lowest rating it receives in one of four categories: deck, superstructure, substructure, and culvert (Office of Engineering Bridge Division, FHWA, DOT 1995). However, if a bridge is not a culvert, then the overall condition is based off the lowest rating of the three remaining categories.
Vessel capacity calling at ports is limited by surrounding bridge air drafts, which is the distance between the mean low-level water line and the lowest point of a bridge or other structure over a shipping channel (Figure 2).
Figure 2. Depiction of a Bridge
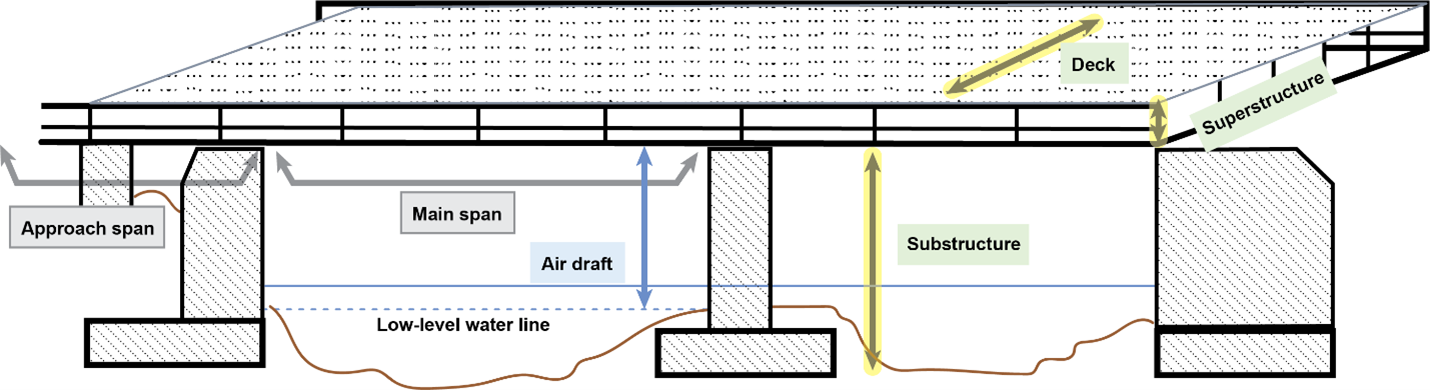
Source: U.S. Department of Transportation, Bureau of Transportation Statistics.
All 12 bridges were inspected and evaluated every 24 months, in compliance with National Bridge Inspection Standards.
The lowest rating category varies across the bridges. None of the three bridges in the Port of Houston have undergone a scour evaluation in the past four years, which can affect the substructure rating. The most recent inspection scheduled for these bridges was in 2024, and the results of this inspection are not yet publicly available. Scour can make a bridge foundation vulnerable and unstable by creating faster-flowing water causing deterioration and compromising the integrity of the bridge’s structure. The Sidney Sherman Bridge had the lowest overall condition ratings with a 6-deck, and two borderline “Poor” (lowest ratings 0-4) ratings of 5-superstructure, and 5-substructure.
The Port of Long Beach features two of the newest bridges: Schuyler F. Heim Bridge (2022) and Long Beach International Gateway (2020), with the highest air draft of 205 feet. Both received high ratings, typically classified as "Good" (7-9), but a category condition rating for each brought them borderline to "Poor" (0-4). A 5-condition rating was recorded for deck conditions of the Schuyler F Heim Bridge and in substructure conditions for the Long Beach International Bridge. This indicates that newer bridges do not always correlate with better overall conditions (Table 1).
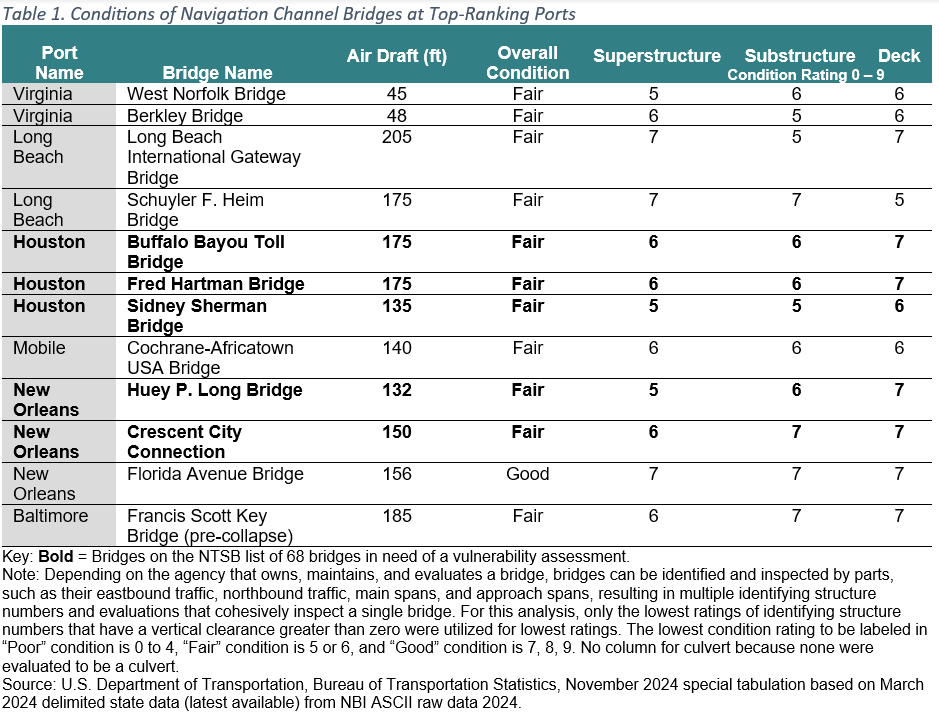
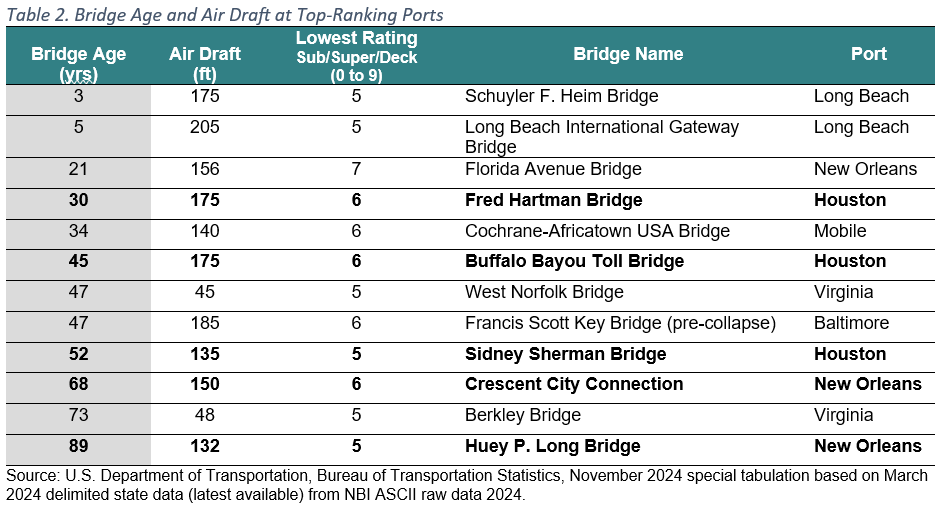
Based on the 2024 National Bridge Inventory (NBI), fewer than 1 percent (4,496) of all U.S. bridges have a vertical clearance greater than zero, with an average air draft of 51 feet and average age of 52 years (1973). Moreover, 75 percent of bridges with a vertical clearance greater than zero that are in “Poor” condition were built before 1971 (53 years). The Port of Virginia has two lower-than-average air draft bridges, West Norfolk, which shares the same age as Key Bridge, and Berkley is 26 years its senior. Notable reconstructions of some of the oldest bridges—excluding any painting or essential maintenance—include Virginia’s Berkley Bridge in 1991 and New Orleans’ Huey P. Long Bridge in 2013. These reconstructions focused on expansion, not replacing the original structures or aging systems, making the Port of New Orleans continue to manage some of the oldest structures, including the Crescent City Connection Bridge (1957) (Table 2).
Bridges that become inaccessible, can result in detour length between 3 to 58 miles. These estimates represent the alternative routes for all vehicles, including trucks, which excludes tunnel routes due to HAZMAT regulations. The Port of Mobile, which handled 50.5 million short tons of cargo in 2022, would experience the longest detours if the 1.4 miles long (7,291.4 ft) Cochrane-Africatown USA Bridge were closed. Due to limited driving routes, a vehicle would need to drive at least 58 additional miles (Table 3).
The Crescent City Connection at the Port of New Orleans is the second shortest bridge, measuring 0.6 miles in length. However, if this bridge were to close, the average daily traffic (ADT) of 442,908 vehicles, which includes 110,727 trucks, would be forced to take a detour of an additional 20 miles. In contrast, the longest bridge, the Buffalo Bayou Toll Bridge, is over 10,000 feet long and had an ADT of more than 65,000 vehicles in 2023 resulting in a detour of 16 additional miles (Table 3).
In 2023, 71 percent of all vessel transits at the Port of Houston required vessels to travel under at least one of its navigation channel bridges to reach a terminal. As the highest-ranked port for total tonnage, accounting for 293.8 million short tons of freight, vessels traveled under the Fred Hartman Bridge 5,204 times, averaging 434 transits per month. In addition to this bridge, the port also includes the Buffalo Bayou Bridge and the Sidney Sherman Bridge, which recorded over 400,000 average daily vehicles in 2020. Closure of the Fred Hartman Bridge, which spans 2 miles, would result in over 97,000 vehicles (as estimated in 2019) having to detour at least 19 additional miles. Furthermore, vessels would need to take a detour of 127 nautical miles to reach Freeport, TX, the nearest port (Table 3) (Office of Coast Survey, National Ocean Service (NOS) 2025).
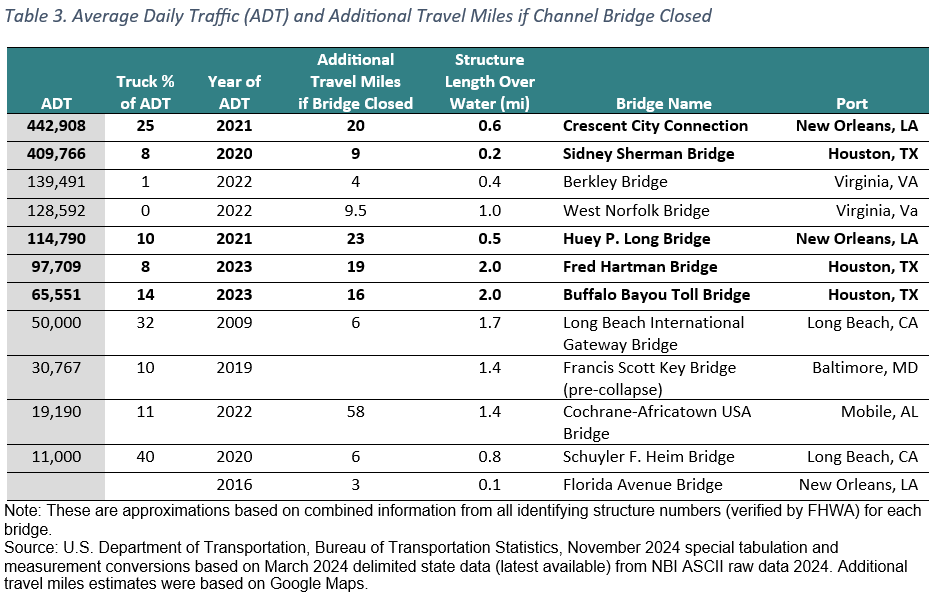
Furthermore, eight out of the eleven bridges had an ADT that exceeded the Port of Baltimore’s Francis Scott Key Bridge by at least 20,000 vehicles. A Johns Hopkins University study estimated that three bridges at the Port of New Orleans and Port of Houston are at high risk of vessel collision. The Huey P. Long Bridge could experience a collision every 17 years, the Crescent City Connection every 34 years, and the Fred Hartman Bridge every 47 years (Rosen 2025).
Many more bridges cross navigation channels within port vicinities, including these six top-ranking ports. Continuing to investigate these bridges should be a top priority for safety and resiliency. To stay updated on port performance and upcoming statistical briefs on the Navigation Channel Bridges please select sign up for email updates at the Port Performance Freight Statistics Program.
To receive updates from BTS directly to your email, please consider subscribing to our GovDelivery service.