
Taking the Measure of Transportation in 2021
Data spotlights represent data and statistics from a specific period of time, and do not reflect ongoing data collection. As individual spotlights are static stories, they are not subject to the Bureau of Transportation Statistics (BTS) web standards and may not be updated after their publication date. Please contact BTS to request updated information.
At the Bureau of Transportation Statistics, we produced a wide variety of charts and tables to understand transportation and its consequences in 2021. We selected three of those measures to highlight the year in transportation: Daily Trips, Domestic Flight Departures, and the Freight Transportation Services Index. If they tell one overall story for 2021, that story begins and ends with COVID-19.
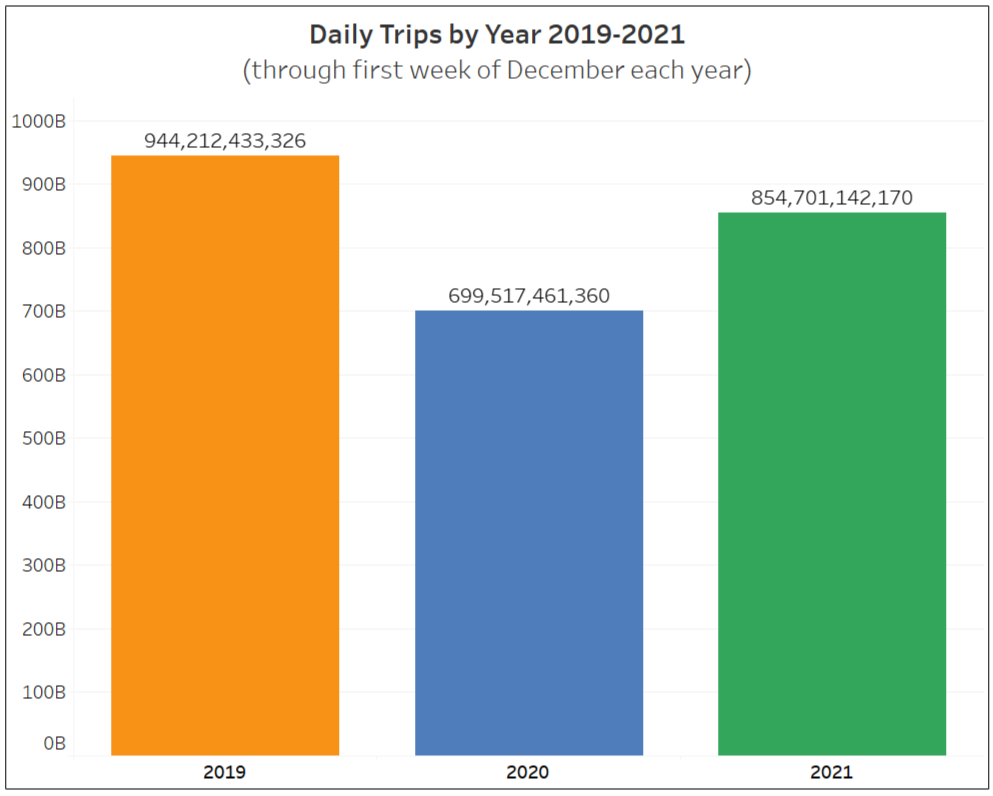
Daily Trips: The story of transportation in 2021 starts with people.
BTS measures trips by anonymized movements of cell phones and other location device services. Through the first week of December, people across the U.S. made 855 billion trips in 2021. That’s 91% of the trips Americans made in pre-pandemic 2019.
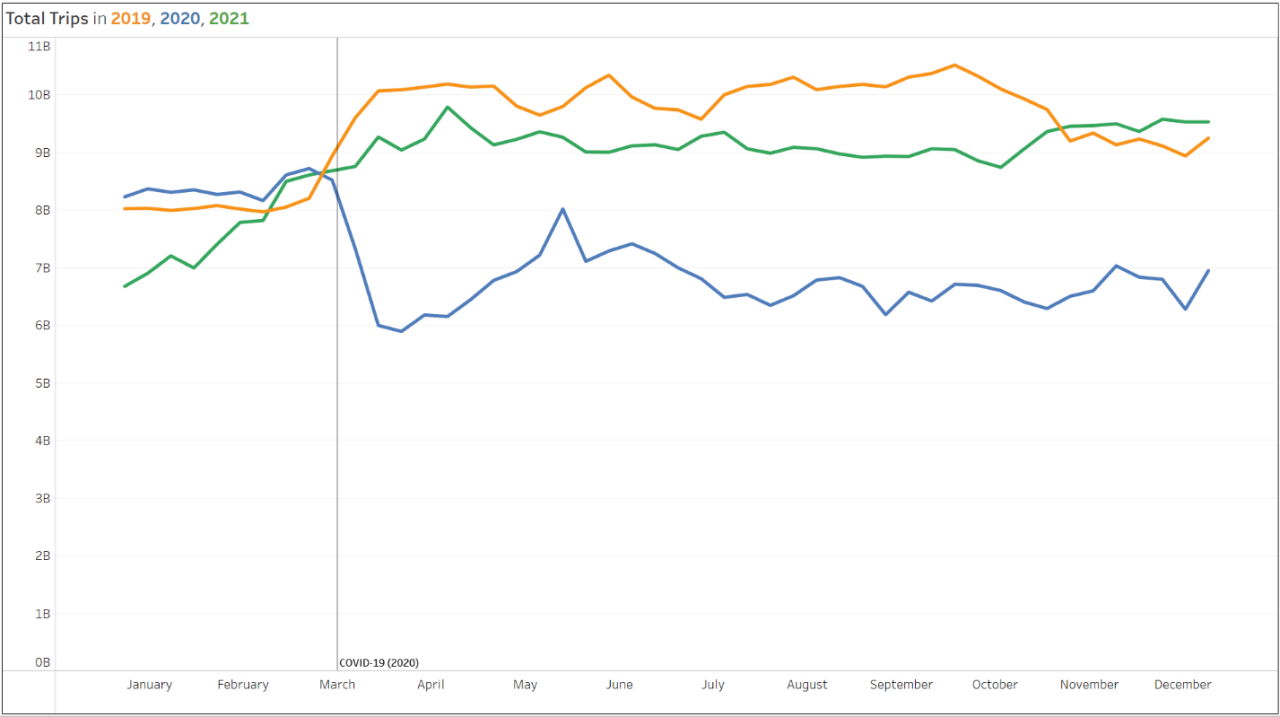
As the chart below shows, the weekly totals of trips in 2021 finally exceeded the weekly totals in 2019 starting at the end of October.
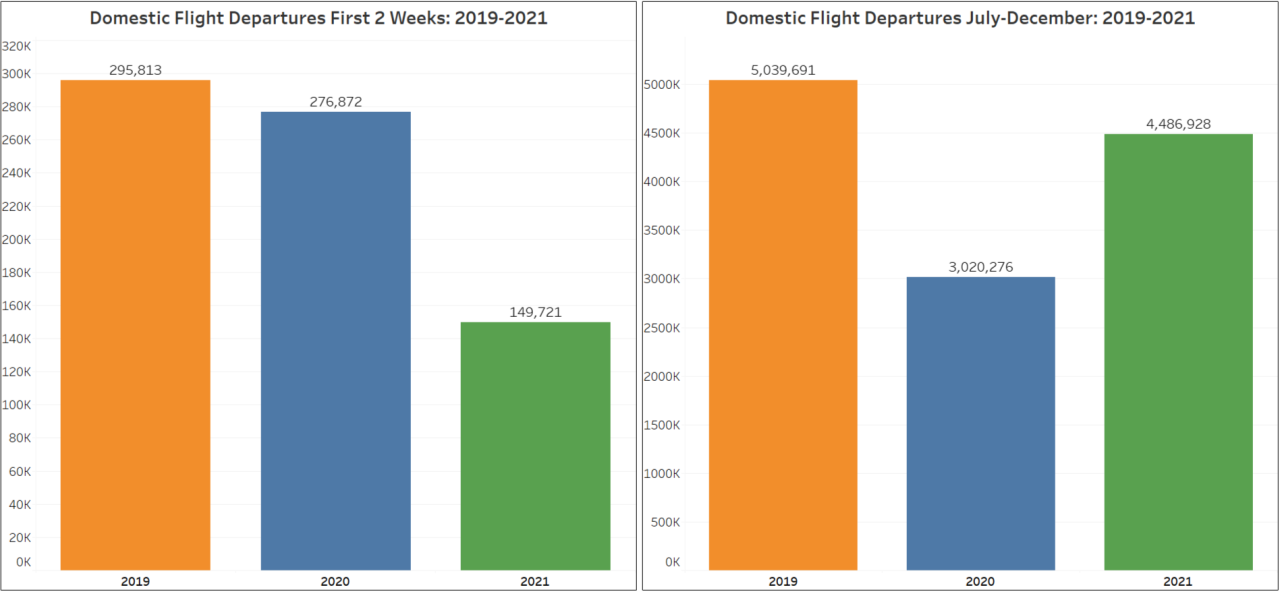
Domestic Flight Departures: Air travel catches up in latter half of 2021
In the first two weeks of 2021, the number of domestic flights in the U.S. was only 69% of those operated in the same period of 2019 and the pre-pandemic weeks of 2020. By the second half of 2021, however, air travel was rapidly approaching a pre-pandemic normal. Domestic flights departing from July through December were at about 90% of the corresponding number of flights in 2019.
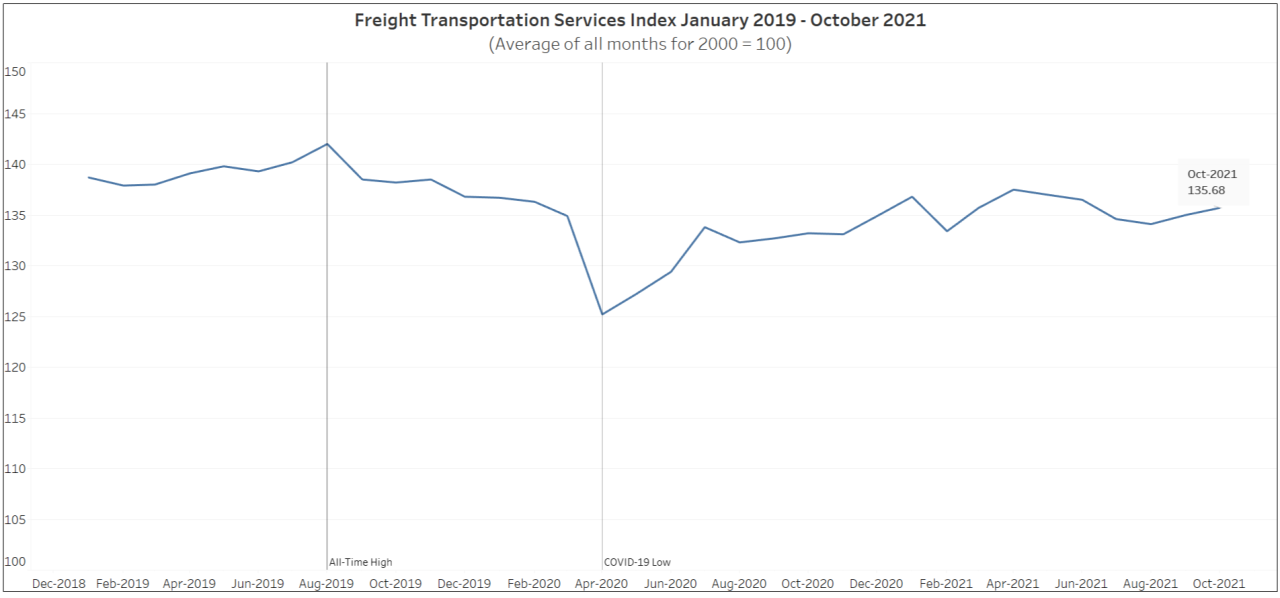
Freight Transportation Services Index: 2021 ranks as third highest year on record
The BTS Freight Transportation Services Index (Freight TSI) measures the volume of freight moved monthly by the for-hire transportation sector in the United States. By October 2021, the monthly average reached 135.7 (or 35.7 percent above the average for all months in the reference year 2000). The October value was substantially above the COVID-19 low of 125.2 following the beginning of the pandemic in April 2020, but the index is still below its all-time high of 142.0 in August 2019.
To produce more goods and deliver them to consumers, industries require additional freight transportation services. Because changes in the Freight TSI reflect changes in the demand for goods and services, an increasing Freight TSI generally indicates a growing economy. COVID makes the picture more complicated because disruptions to the availability of transportation workers affect the ability of the freight system to meet demands for freight movement, and some of the increased freight demand reflects a shift in consumer spending from services to goods while activities such as eating out were restricted.
What will transportation look like in 2022?
As 2021 gives way to 2022, disruptions in passenger travel and concerns with supply chains remain in the news. BTS will continue to measure key facets of transportation on a weekly basis at https://www.bts.gov/twit and an even larger number of aspects on a monthly basis at https://www.bts.gov/mts. Statistics are also available from the national level at https://www.bts.gov/nts to the county level at https://www.bts.gov/ctp.
However you measure it, BTS wishes you a great new year!