
Transborder Trends: the Weight of Freight
Data spotlights represent data and statistics from a specific period of time, and do not reflect ongoing data collection. As individual spotlights are static stories, they are not subject to the Bureau of Transportation Statistics (BTS) web standards and may not be updated after their publication date. Please contact BTS to request updated information.
The Bureau of Transportation Statistics TransBorder freight data program measures the value of freight flows by mode of transportation with Canada and Mexico by month and year. A recent analysis of this data indicates a notable deviation in the dollar value of imports and exports carried by truck across US borders as well as the weight of imports carried by truck. Specifically, HS chapter 84 includes machinery and mechanical equipment used in the automotive industry such as parts for engines and transmissions. Chapter 85 covers computer components and electrical parts such as the onboard computer, infotainment system, and navigation.
This data spotlight highlights an accelerating discrepancy in the dollar value and weight of U.S. truck freight with Canada and Mexico, specifically for goods classified under HS chapters 84 - 85. Since 2008, and particularly since 2021, the proportional relationship between the dollar value and weight of these shipments has changed.
These two commodity groups (HS 84-85) comprised 26.3 percent or $421.4 billion of all freight with Canada and Mexico in 2024, which was valued at $1.6 trillion. Trucks moved 90.0 percent of the freight in HS chapters 84 and 85. The land port at Laredo, Texas handled 28.4 percent of the volume by dollar value for freight shipments in commodity groups 84 and 85.
Overview of US freight with Canada and Mexico by mode of transportation for HS 84 and 85: 2024
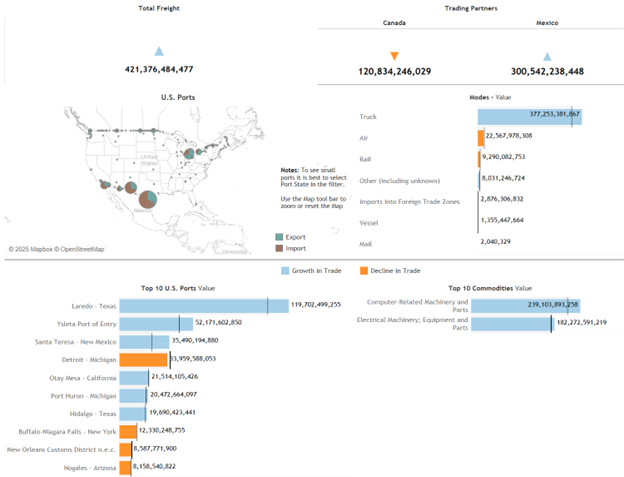
Note: Transborder Freight Statistics Program captures the value of all transborder shipments but the weight only for imports except Air and Vessel.
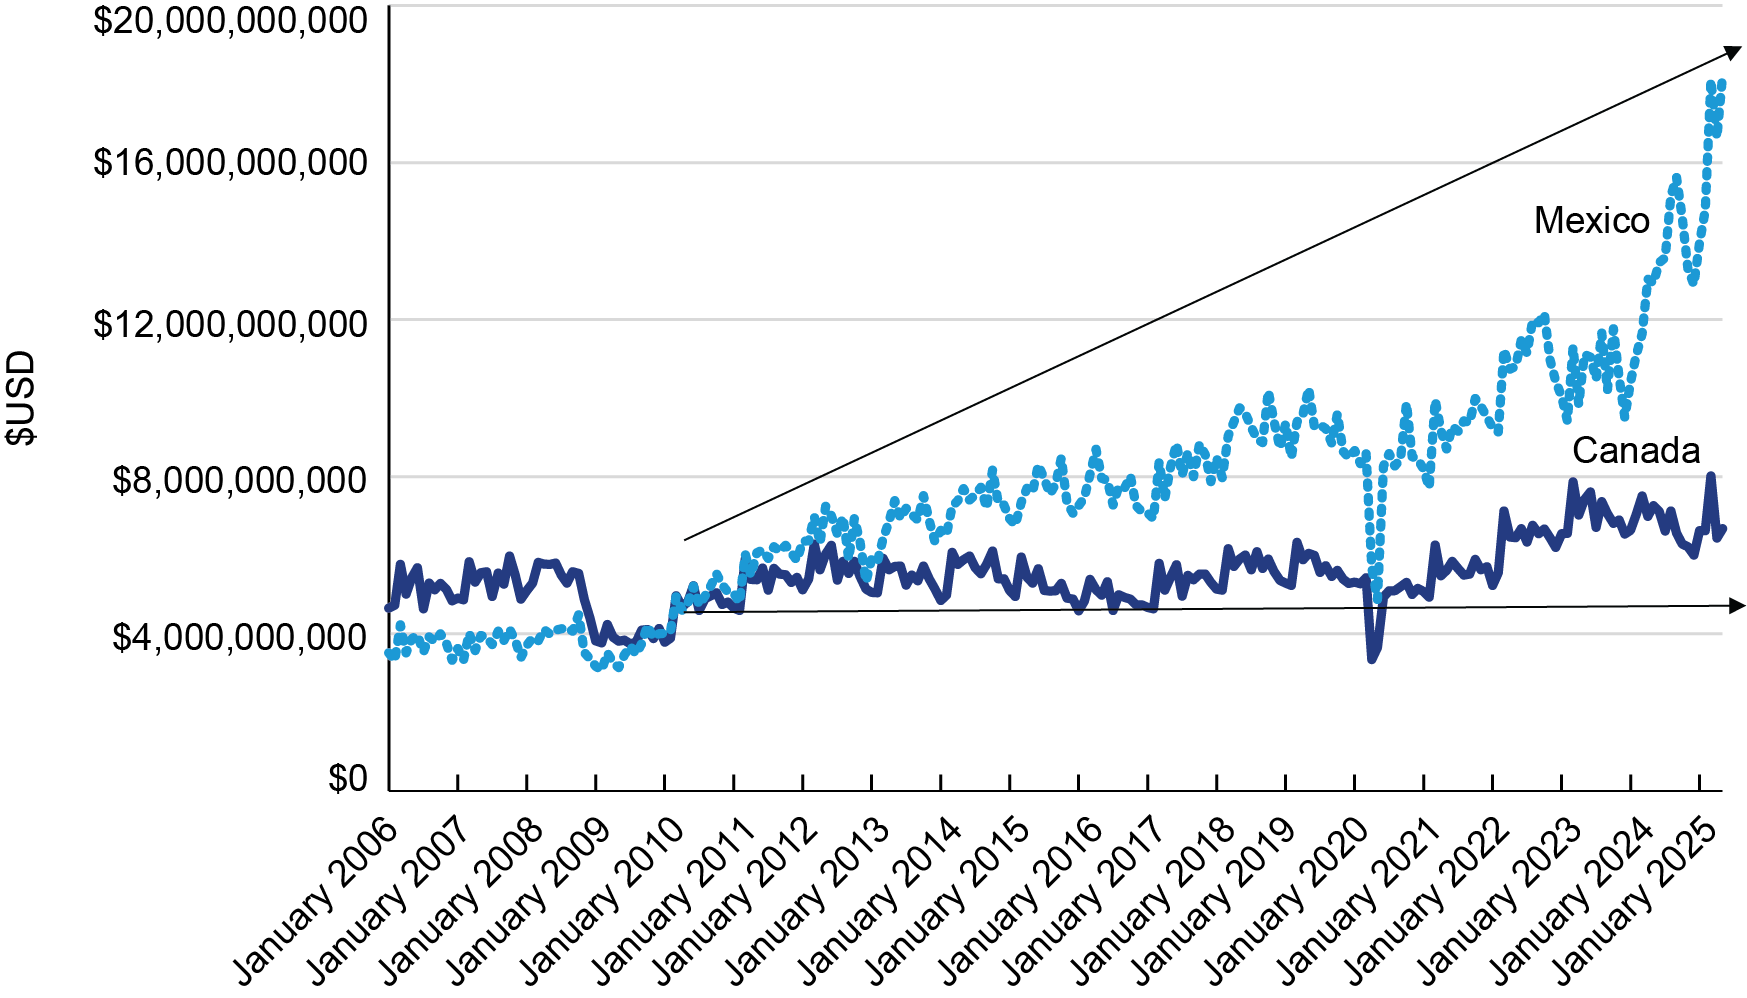
From, April 2021 to May 2025, the dollar value of freight for HS 84-85 by truck with Canada increased 20.4 percent ($4.7 to $5.6 billion) while increasing 91.1 percent with Mexico ($8.3 to $15.8 billion). The charts below show the value of freight for HS 84-85 transported by truck with Canada and Mexico.
Dollar value of HS 84 and 85 freight by truck with Canada and Mexico
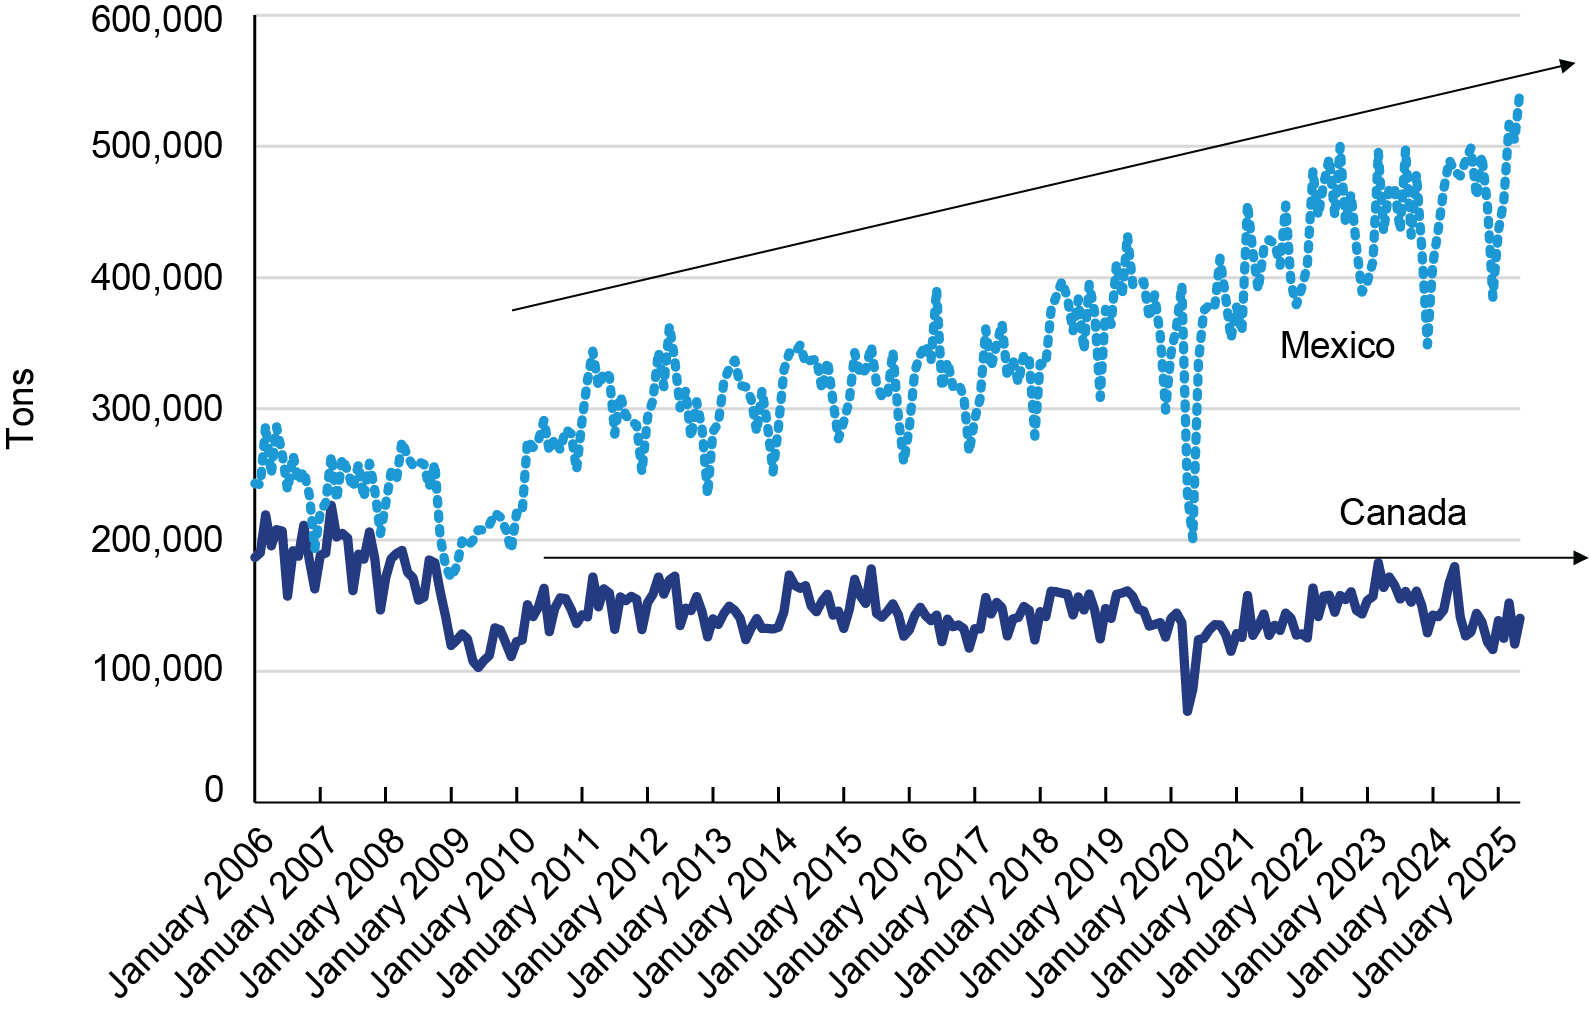
A notable discrepancy in the dollar value and weight of truck freight for HS 84-85 with Canada and Mexico began in 2008 and has since accelerated, particularly since 2021. While historical data usually shows a proportional relationship between dollar value and weight, this has recently changed.
Specifically, from April 2021 to May 2025, the weight of HS 84-85 truck freight with Mexico surged by 29.4 percent (from 419,343 to 542,708 tons), a much faster rate than the 10.3 percent increase seen with Canada (from 127,262 to 140,390 tons).
Import weight (tons) of HS 84 and 85 freight by truck with Canada and Mexico
The Bureau of Transportation Statistics TransBorder Freight program provides North American freight data by mode of transportation, commodity type, and geographic detail for U.S. exports to and imports from Canada and Mexico. The data are used for trade corridor studies, transportation infrastructure and border planning, marketing and logistics analyses, and other transportation research. BTS publishes a monthly statistical release that highlights key trends in this data, and are often cited by popular trade publications and media outlets. The interactive data dashboards below allow users to visualize data by mode of transportation, commodity, and port of entry or exit.
Note: The dollar values in this report are nominal and have not been adjusted for inflation. For an accurate comparison over time, please use the Bureau of Labor Statistics’ Inflation Calculator to convert them to real values, which account for changes in purchasing power.
To receive updates from BTS directly to your email, please consider subscribing to our GovDelivery service.