Transportation Statistics for Earth Day
Data spotlights represent data and statistics from a specific period of time, and do not reflect ongoing data collection. As individual spotlights are static stories, they are not subject to the Bureau of Transportation Statistics (BTS) web standards and may not be updated after their publication date. Please contact BTS to request updated information.
The sun has emerged from its total solar eclipse on April 8 to shine on Earth Day on April 22. Earth Day has focused attention since 1970 on environmental consequences of human activity including transportation. The Bureau of Transportation Statistics (BTS) features multiple resources that help understanding of the relationships of transportation to energy, the environment, and climate, including nearly 30,000 documents that include the keyword “environment” in the National Transportation Library.
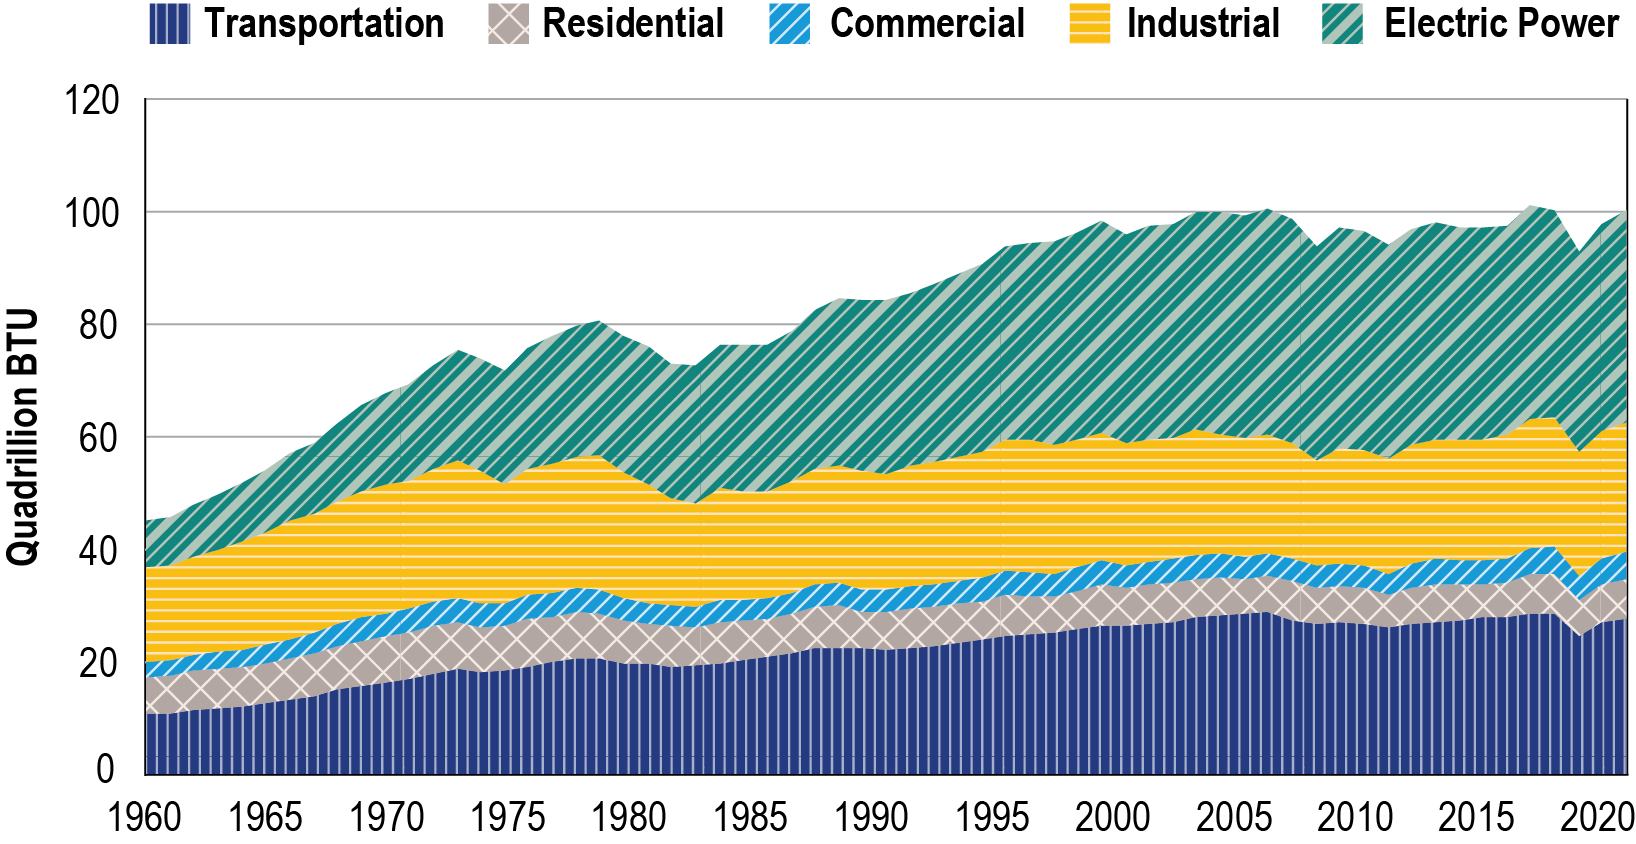
Each year, BTS publishes the Transportation Statistics Annual Report (TSAR) features an entire chapter on energy and sustainability in Chapter 6. Per the TSAR, U.S. transportation vehicles, cars, trucks, buses, trains, planes, and ships used 27.5 quadrillion British Thermal Units1 of energy in 2022, more than residential, commercial, or industrial end-use sectors.

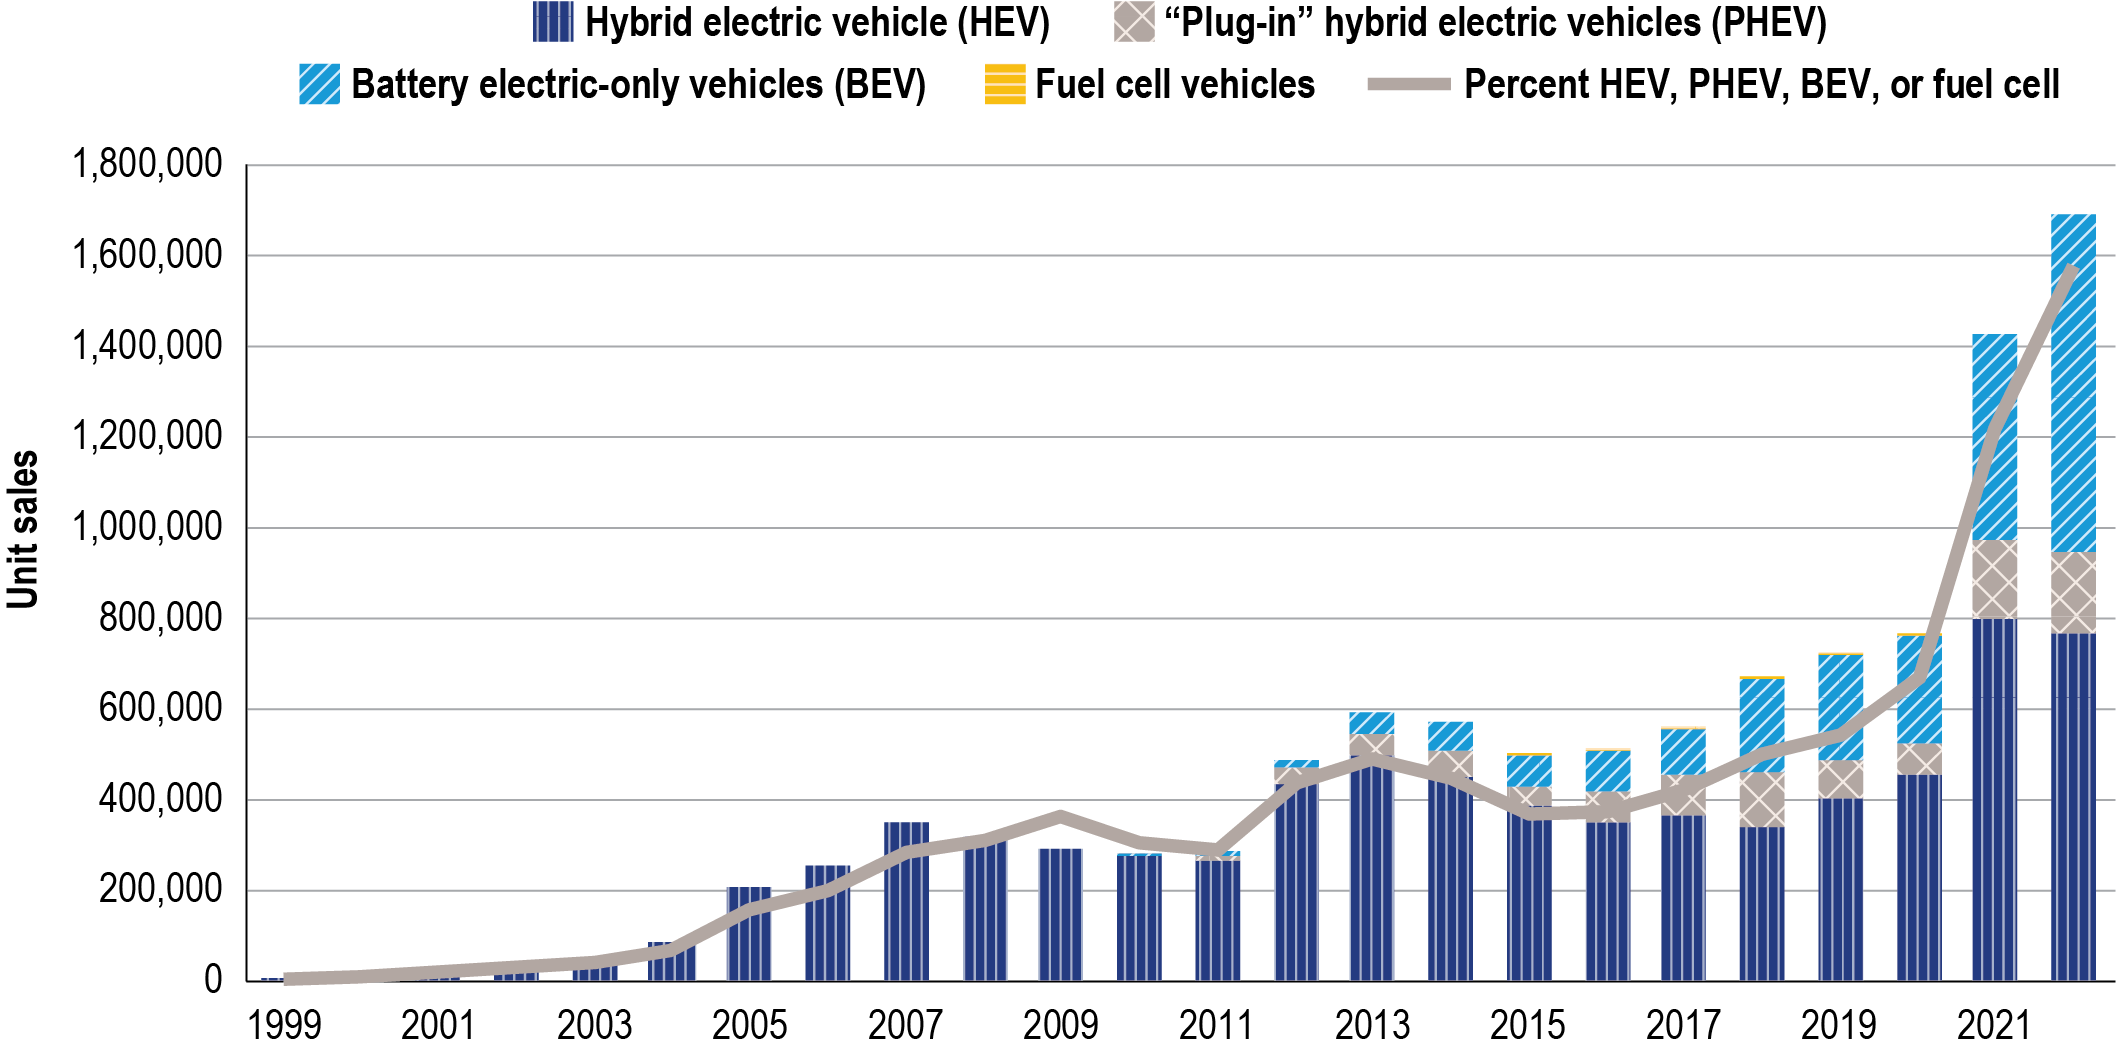
The use of electricity by transportation and its full environmental effects are becoming increasingly important. Electric vehicle (EV) sales have been growing rapidly in the U.S. and around the world. U.S. sales of battery electric vehicles (BEVs) and plug-in hybrid electric vehicles (PHEVs) grew by 47 percent in model year 2022 over 2021. 2

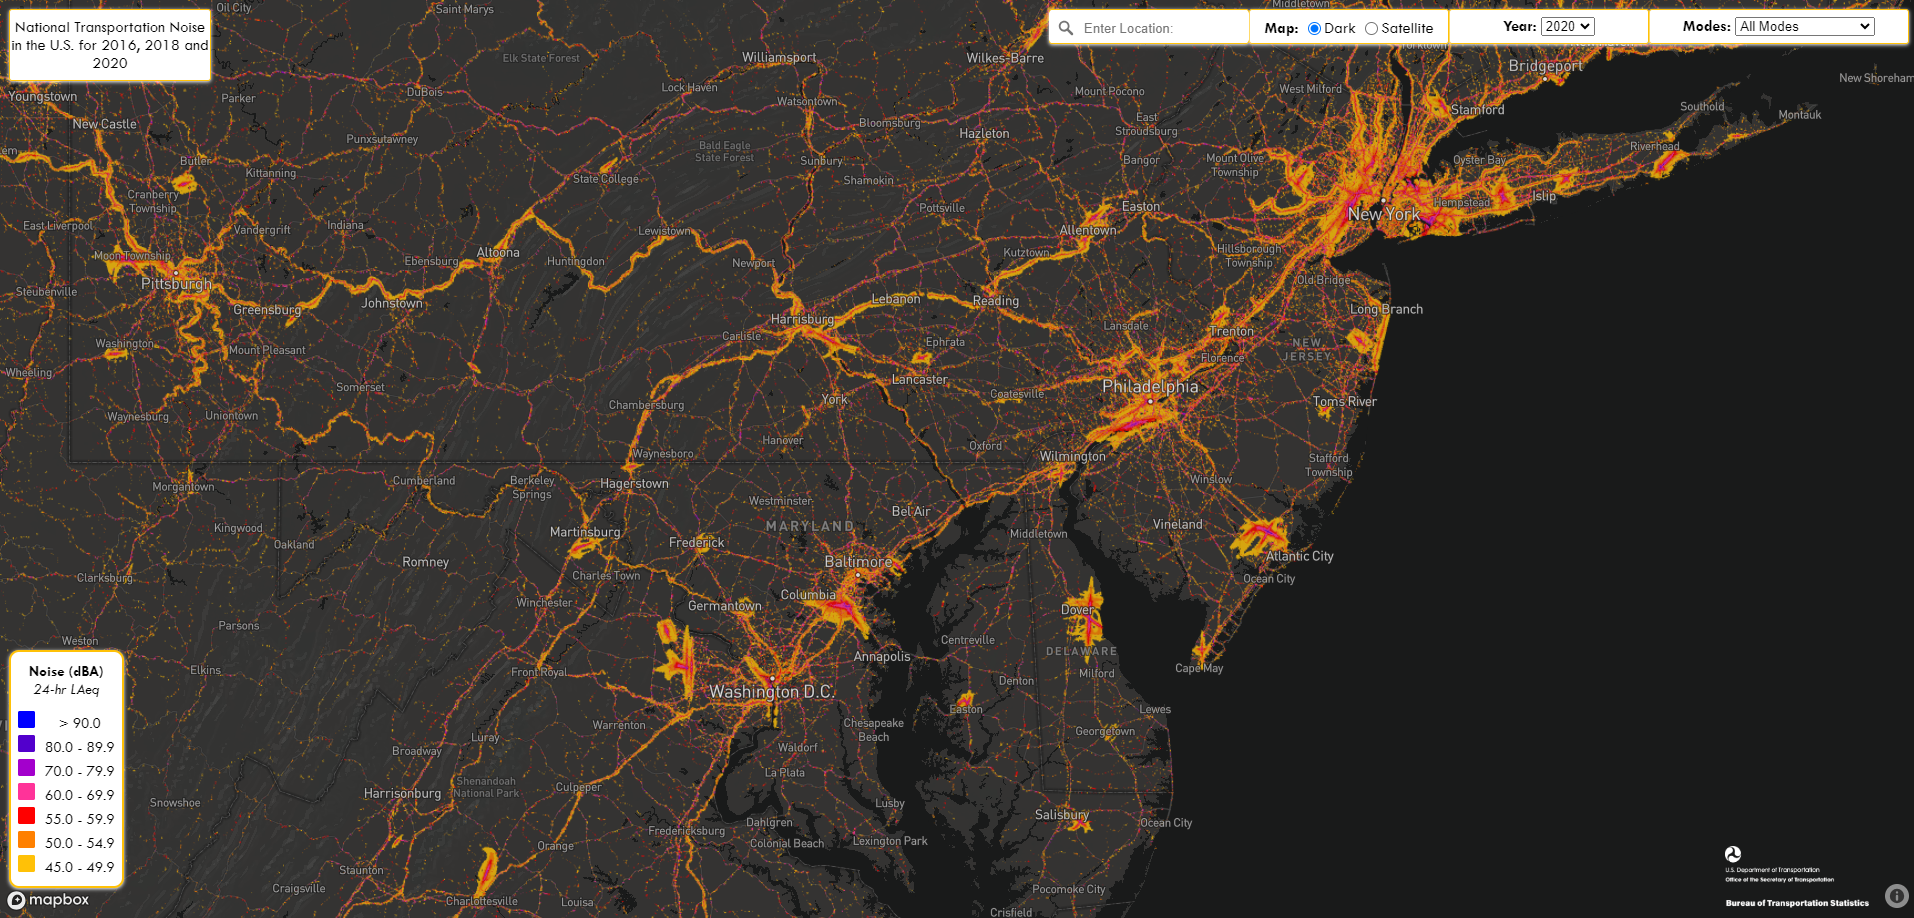
Transportation noise impacts our environment every day. The BTS National Transportation Noise Map provides an opportunity to track trends in transportation-related noise, and gives a basis for understanding of various scenarios, which can help policy-makers and planners prioritize noise-related transportation investments. The map’s data illustrates a national picture of potential exposure to aviation, highway, and rail noise, by mode and collectively, at both the state and county levels.

The noise map is part of the National Transportation Atlas Database, a set of nationwide geographic databases of transportation facilities, networks, and associated infrastructure.
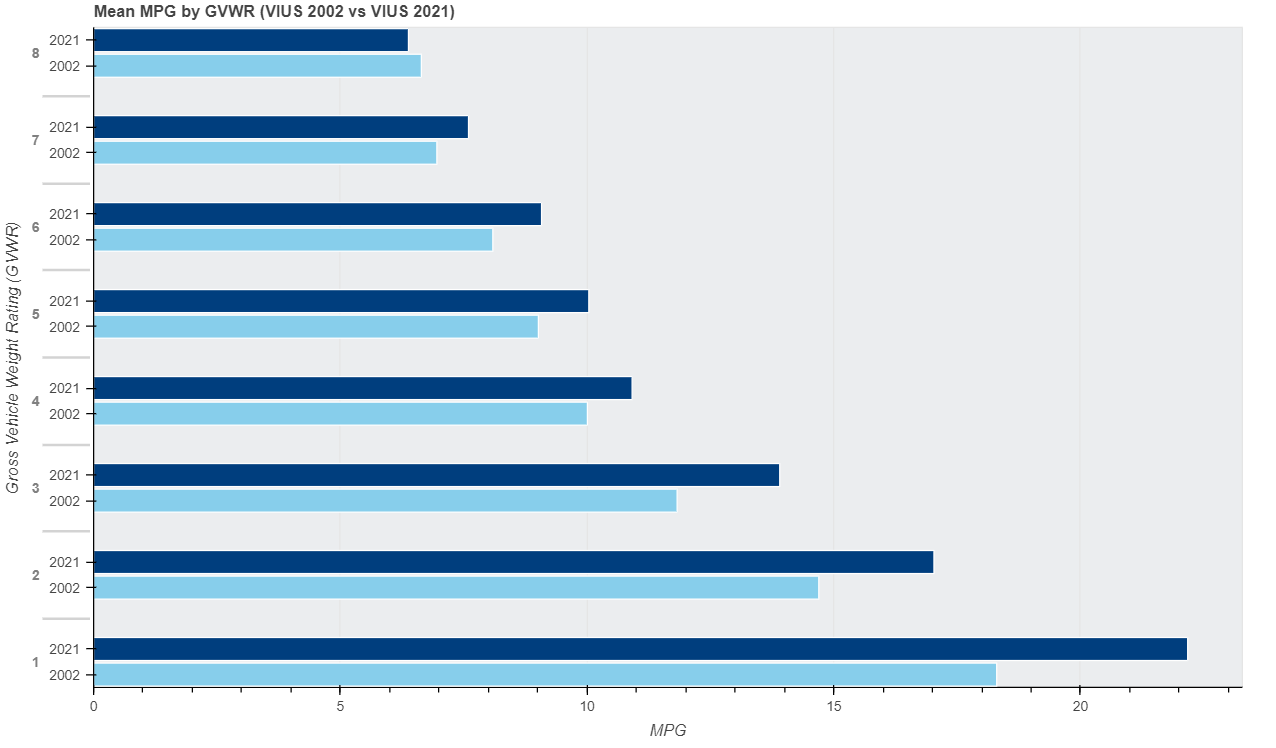
Last September, BTS released the data collected from the 2021 Vehicle Inventory and Use Survey (VIUS)—the first VIUS conducted in two decades. VIUS includes data on the miles traveled, fuel type and consumption, and other characteristic of large and small trucks, vans, mini-vans and sport utility vehicles. VIUS data shows that in 2021, light-duty trucks with a gross vehicle weight rating (GVWR) of less than 10,000 pounds (GVWR 1&2), had an average fuel efficiency of 19.9 miles per gallon (MPG), compared to 17 MPG in 2002. Meanwhile, heavy-duty trucks with a GVWR over 26,000 pounds, had an average fuel efficiency of 6.38 MPG in 2021, compared to 6.64 MPG in 2002.

Later this year, BTS will lead the first ever Electronic Vehicle Inventory and Use Survey (eVIUS). eVIUS will survey a national sample of battery electric vehicles (BEVs) and plug-in hybrid electric vehicles (PHEVs) to collect information about the general use of these vehicles, as well as charging behaviors of EV owners. The data will be used to inform policy related to electric vehicles and charging infrastructure.
Tune in next Earth Day to see what other great products BTS has to offer.
1A British Thermal Unit (BTU) is a measurement energy, specific to heat. It is measured by the amount of heat needed for one pound of water to increase its temperature by one degree Fahrenheit.
2 TSAR chapter 1 page 11.
