
U.S. Border Freight Transportation Resiliency
Data spotlights represent data and statistics from a specific period of time, and do not reflect ongoing data collection. As individual spotlights are static stories, they are not subject to the Bureau of Transportation Statistics (BTS) web standards and may not be updated after their publication date. Please contact BTS to request updated information.
In 2023, the Bureau of Transportation Statistics (BTS) participated in a data-based examination of the U.S.-Canada border with Transport Canada. The primary task of the binational working group was to identify the most consequential land border ports that could be vulnerable to disruption of international freight flows and transportation. The group used freight dollar values and border crossing counts to 1) rank order land ports to identify potential bottlenecks at U.S.-Canada border crossings, and 2) develop a joint framework to measure risks to help promote a more resilient border.
In 2023, the U.S. had $773.9 billion in total freight flows with Canada by all modes of transportation. The largest share (56%) was trucking with total bidirectional freight with Canada at $435.7 billion, and rail in second place (15%) with $113.9 billion.
BTS’ Office of Transportation Analysis (OTA), utilized in-house resources including the North American TransBorder Freight and Border Crossing database programs to develop objective freight statistics to analyze and rank the ports along the Northern border with Canada.
After further analysis, BTS found that the dollar value of U.S. freight flows with Mexico in 2023 was higher ($798.8 billion) than the dollar value with Canada, so BTS expanded its analysis framework to include the ports along the Southern border at the same capacity. Of the $798.8 billion in total bidirectional freight flows with Mexico by all modes of transportation in 2023, the largest share (70.2%) was trucking at $560.6 billion, and rail in second place (11.9%) at $95.4 billion.
The following figures and tables provide a combined view of BTS' TransBorder and Border Crossing data that was used by the joint border working group to develop the port rankings. Since 2022, the TransBorder data began to reveal an interesting trend showing U.S.-Mexico freight in both dollar value and weight was rising faster than U.S.-Canada.
U.S. – Canada Freight by Truck and Rail
Top 10 Land Ports along the U.S. - Canada Border: 2022 - 2023 (Truck + Rail, Millions USD)
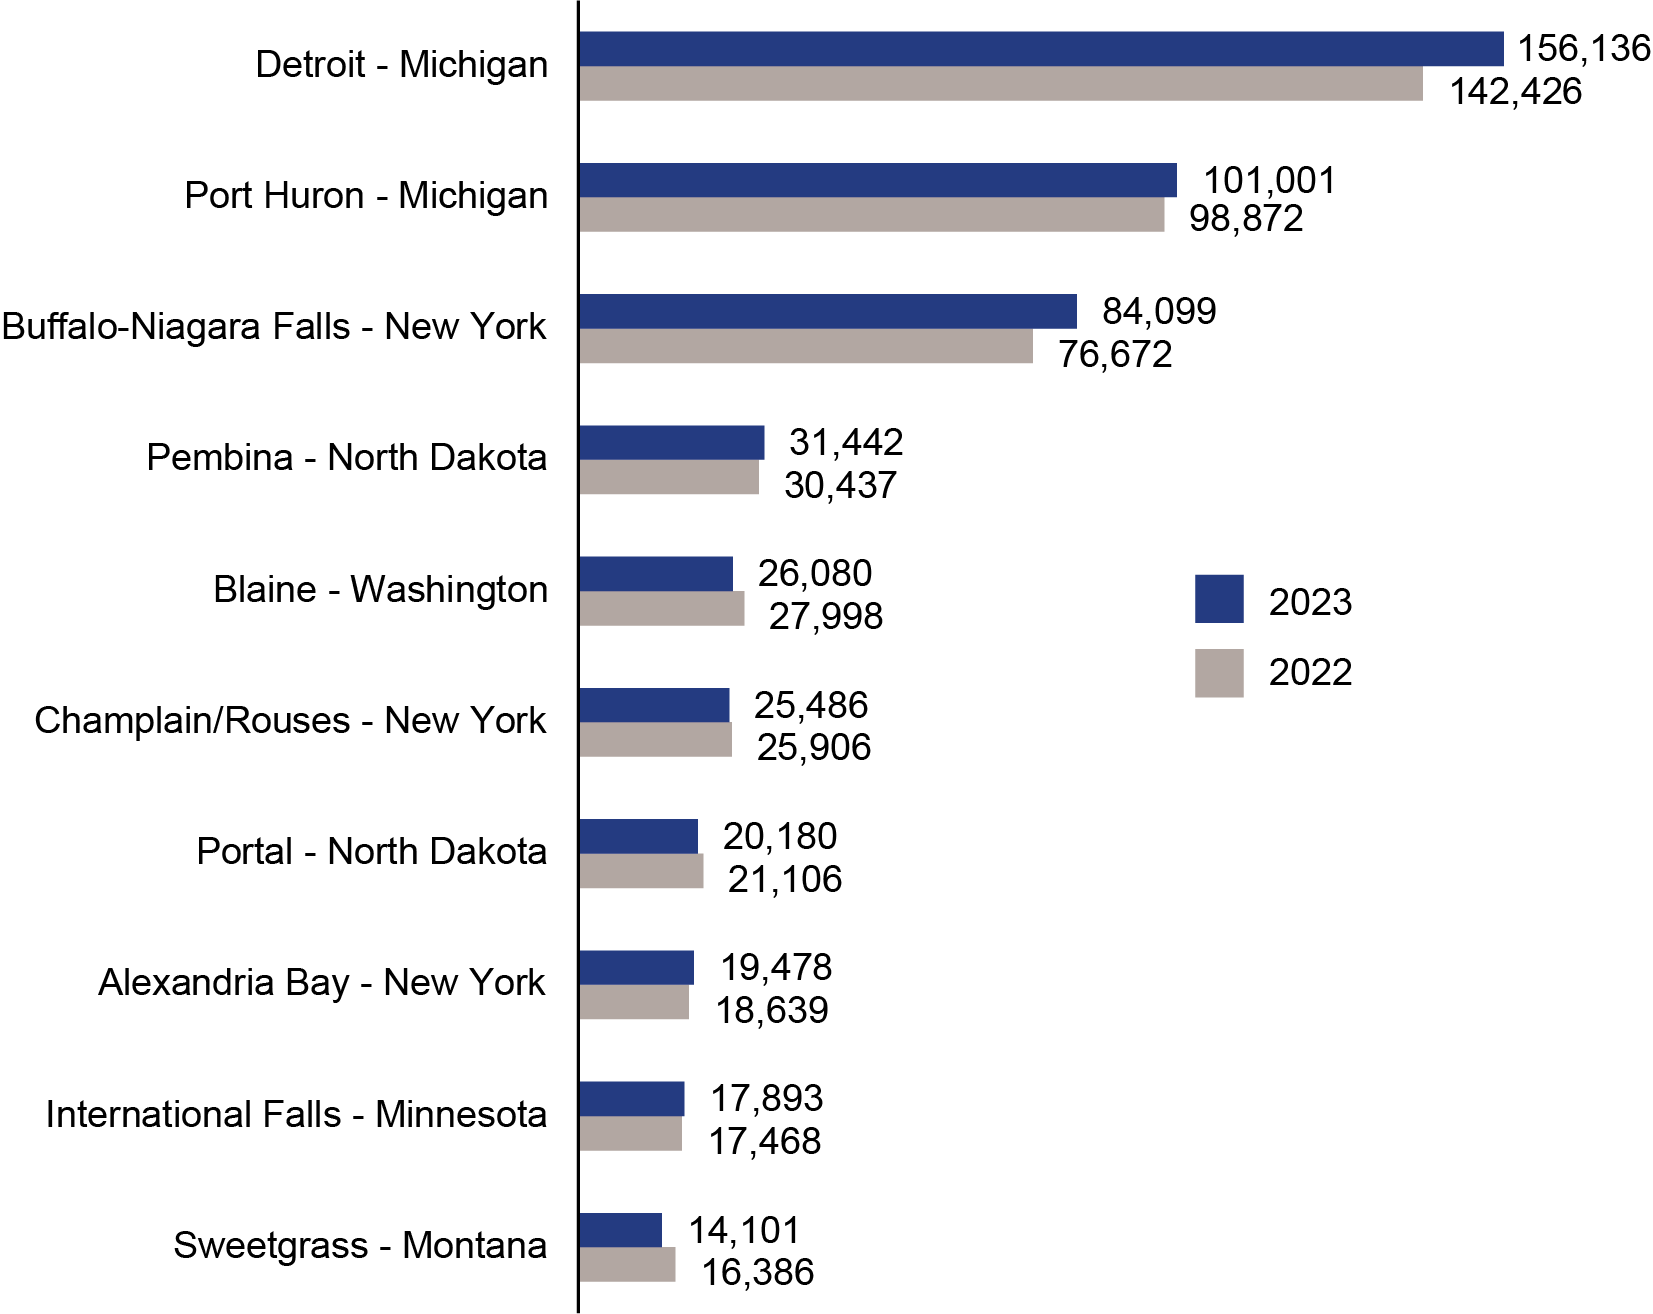
Source: Bureau of Transportation Statistics, Transborder Freight Data, available at https://data.bts.gov/stories/s/myhq-rm6q, adapted from U.S. Census Bureau, International Trade in Goods and Services
Top 10 Truck Ports along the U.S. - Canada Border: 2022 - 2023 (Millions USD)
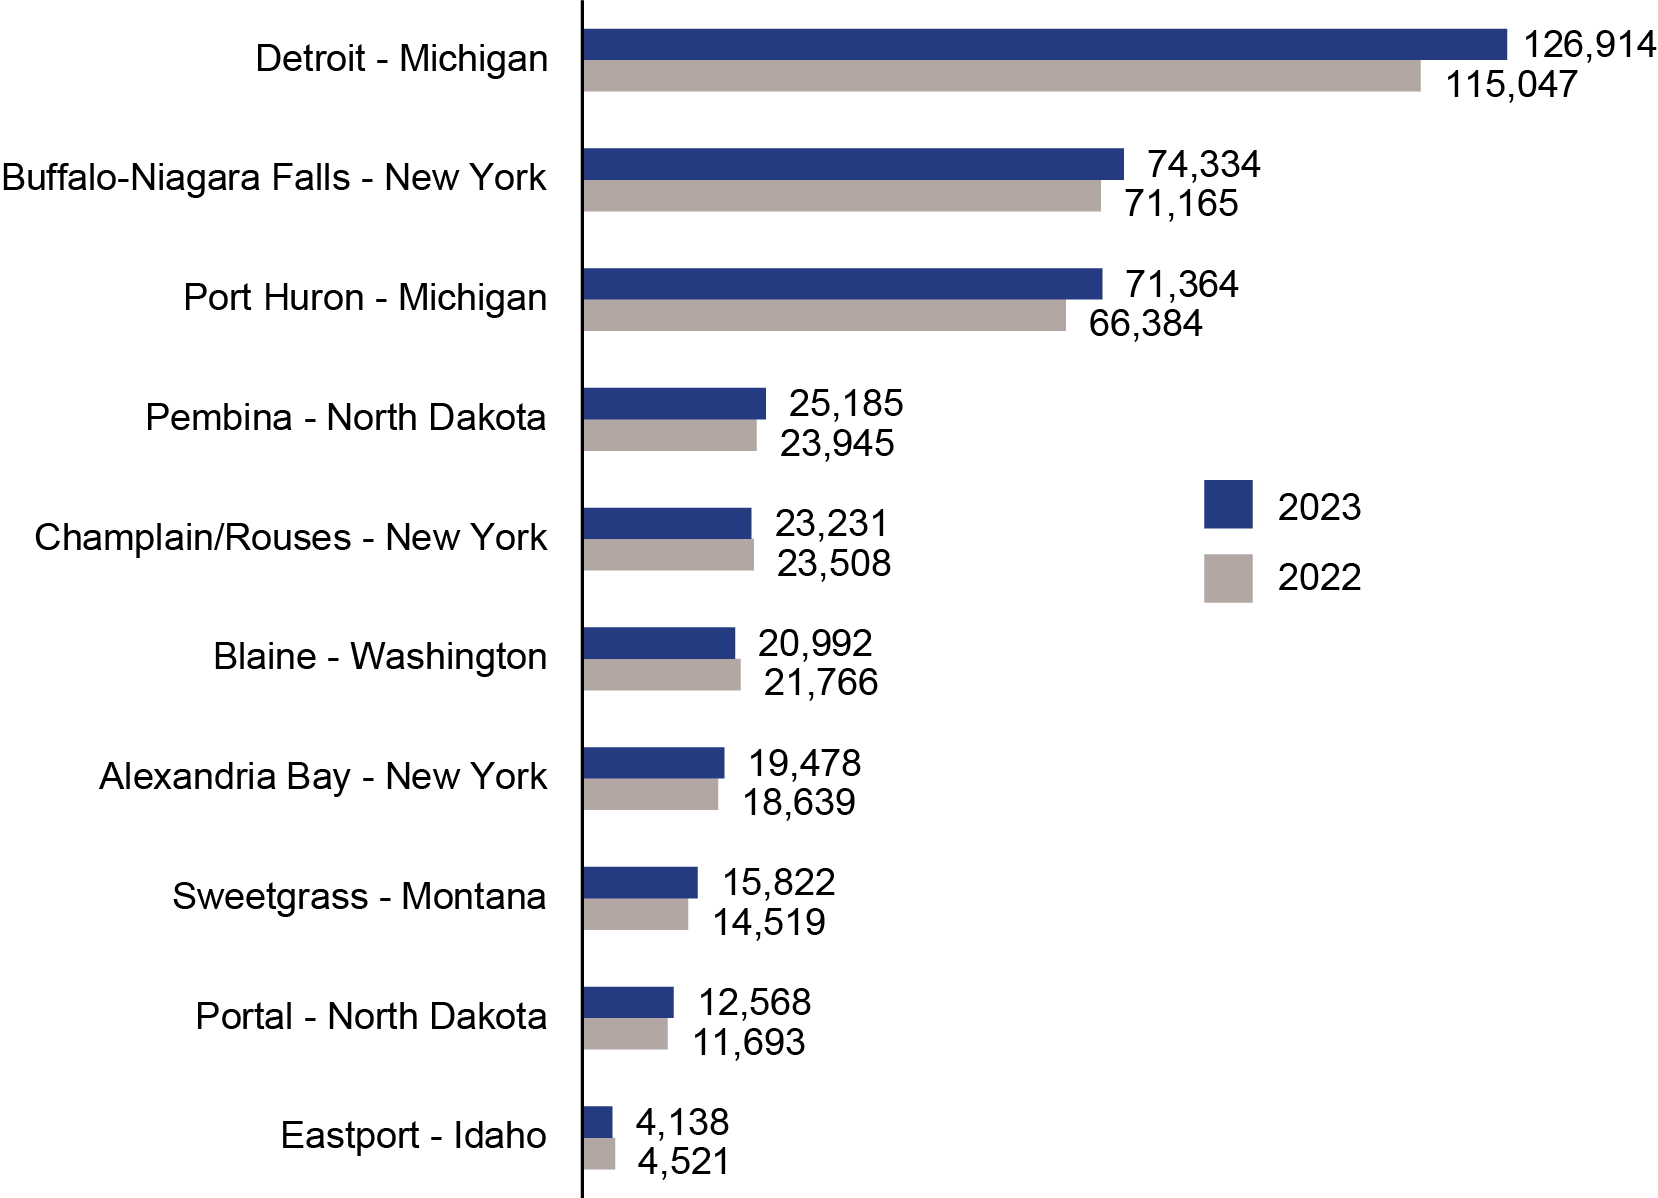
Source: Bureau of Transportation Statistics, Transborder Freight Data, available at https://data.bts.gov/stories/s/myhq-rm6q, adapted from U.S. Census Bureau, International Trade in Goods and Services

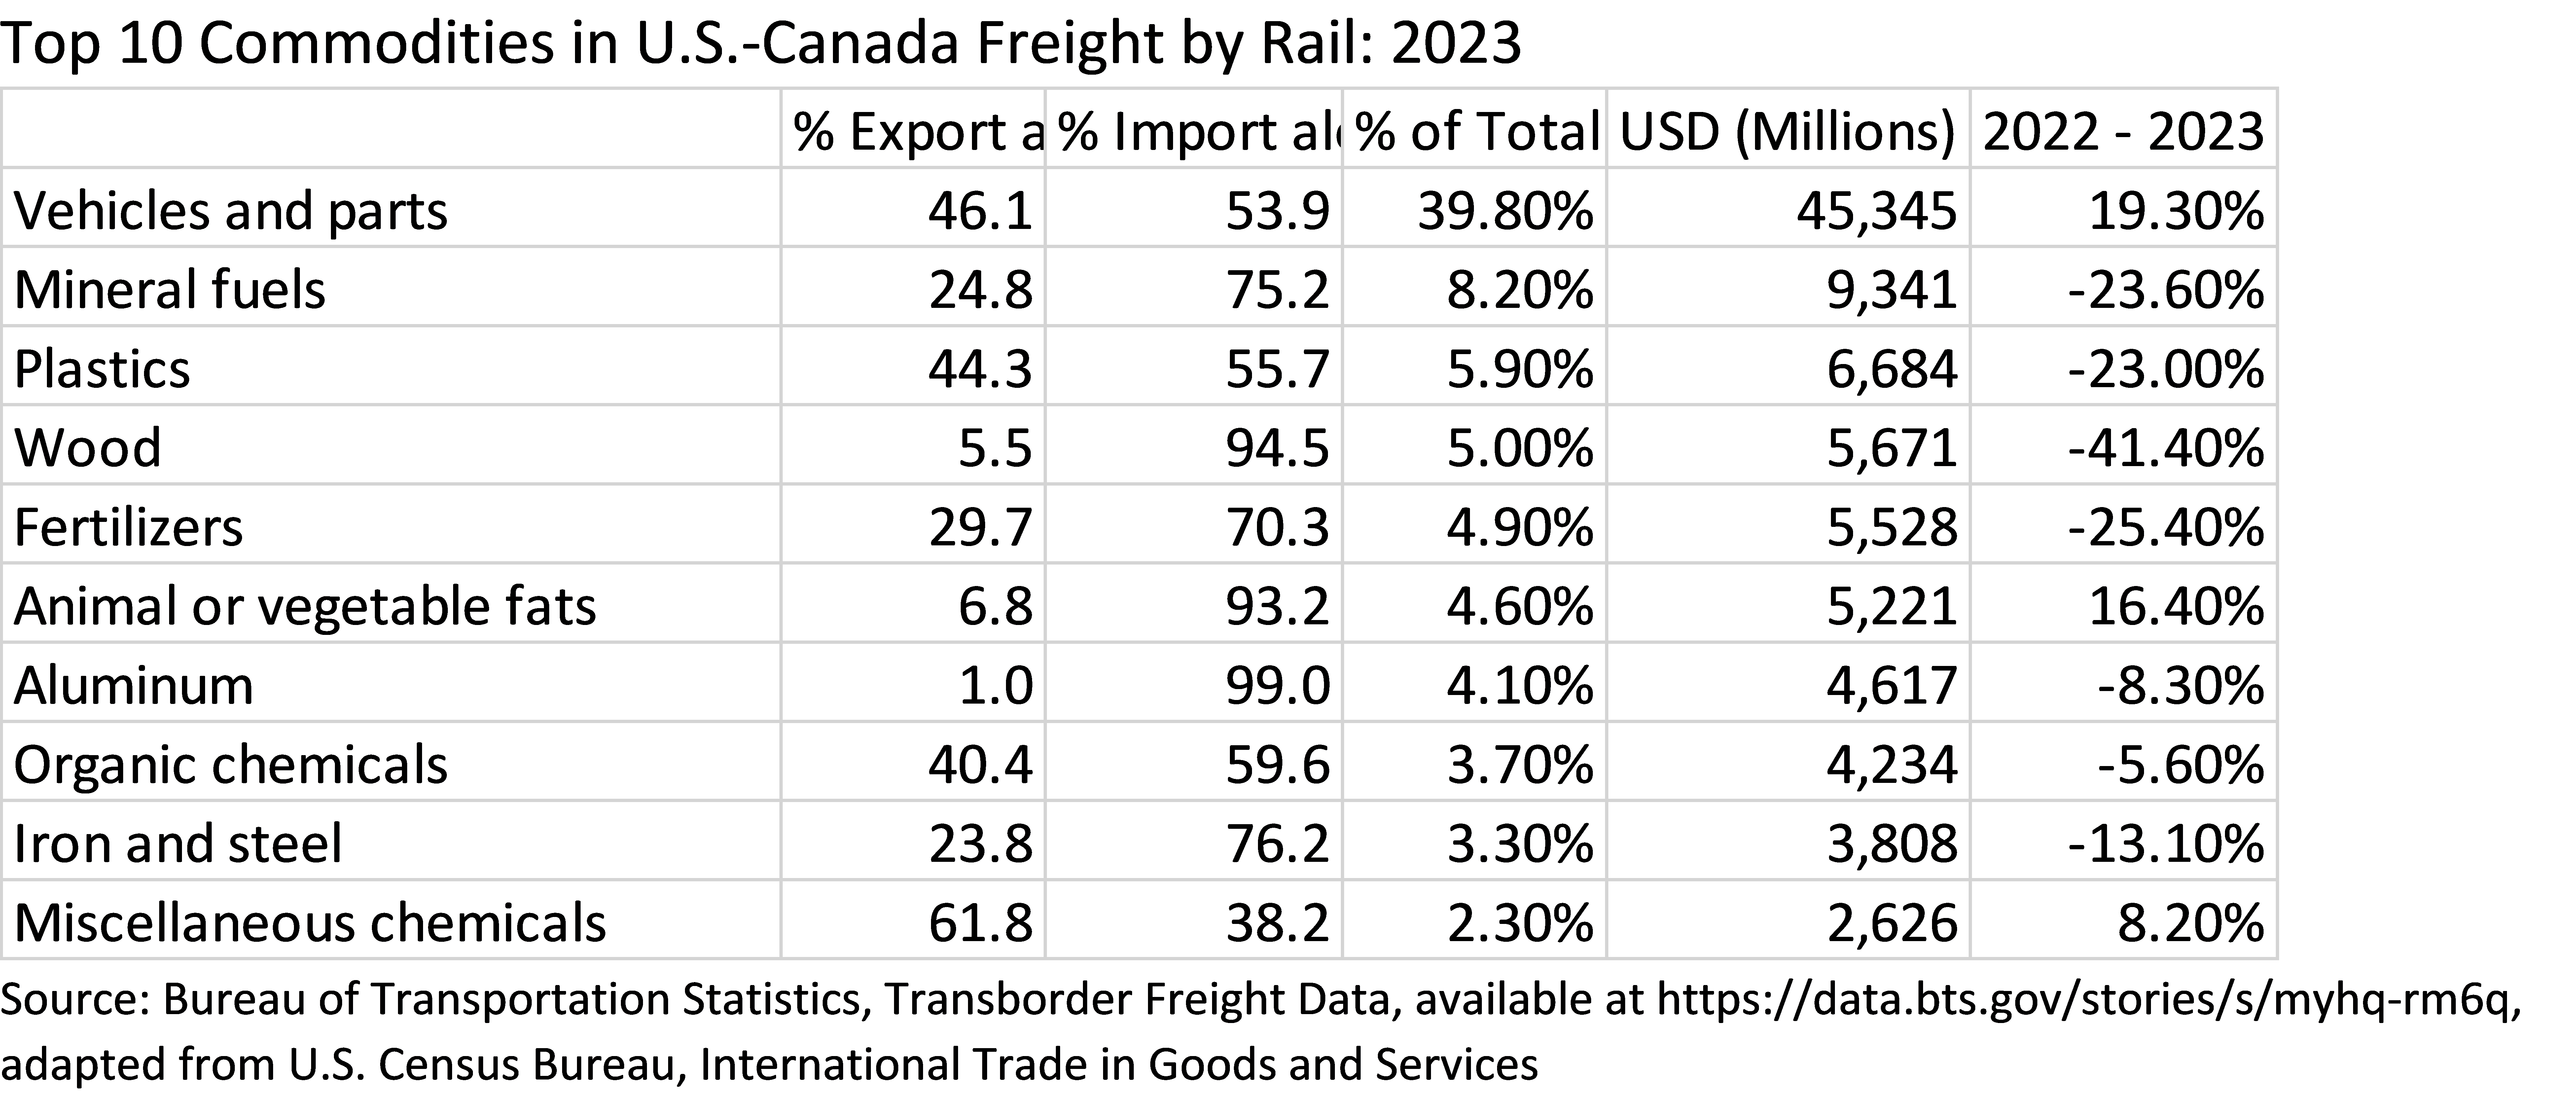
Top 10 Rail Ports along the U.S. - Canada Border: 2022 - 2023 (Millions USD)

Source: Bureau of Transportation Statistics, Transborder Freight Data, available at https://data.bts.gov/stories/s/myhq-rm6q, adapted from U.S. Census Bureau, International Trade in Goods and Services
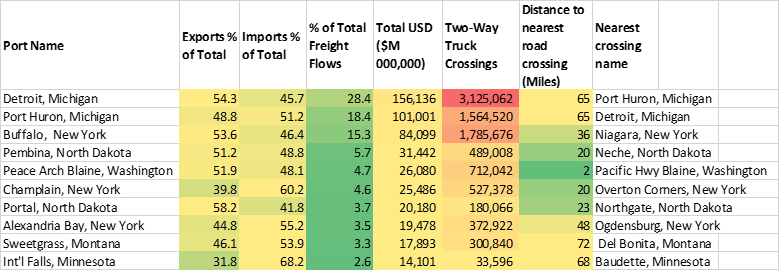
Risk Assessment Ranking: Top U.S. - Canada Freight Crossings: 2023
U.S. – Mexico Freight by Truck and Rail
Top 10 Land Ports along the U.S. - Mexico Border: 2022 - 2023 (Truck + Rail, Millions USD)
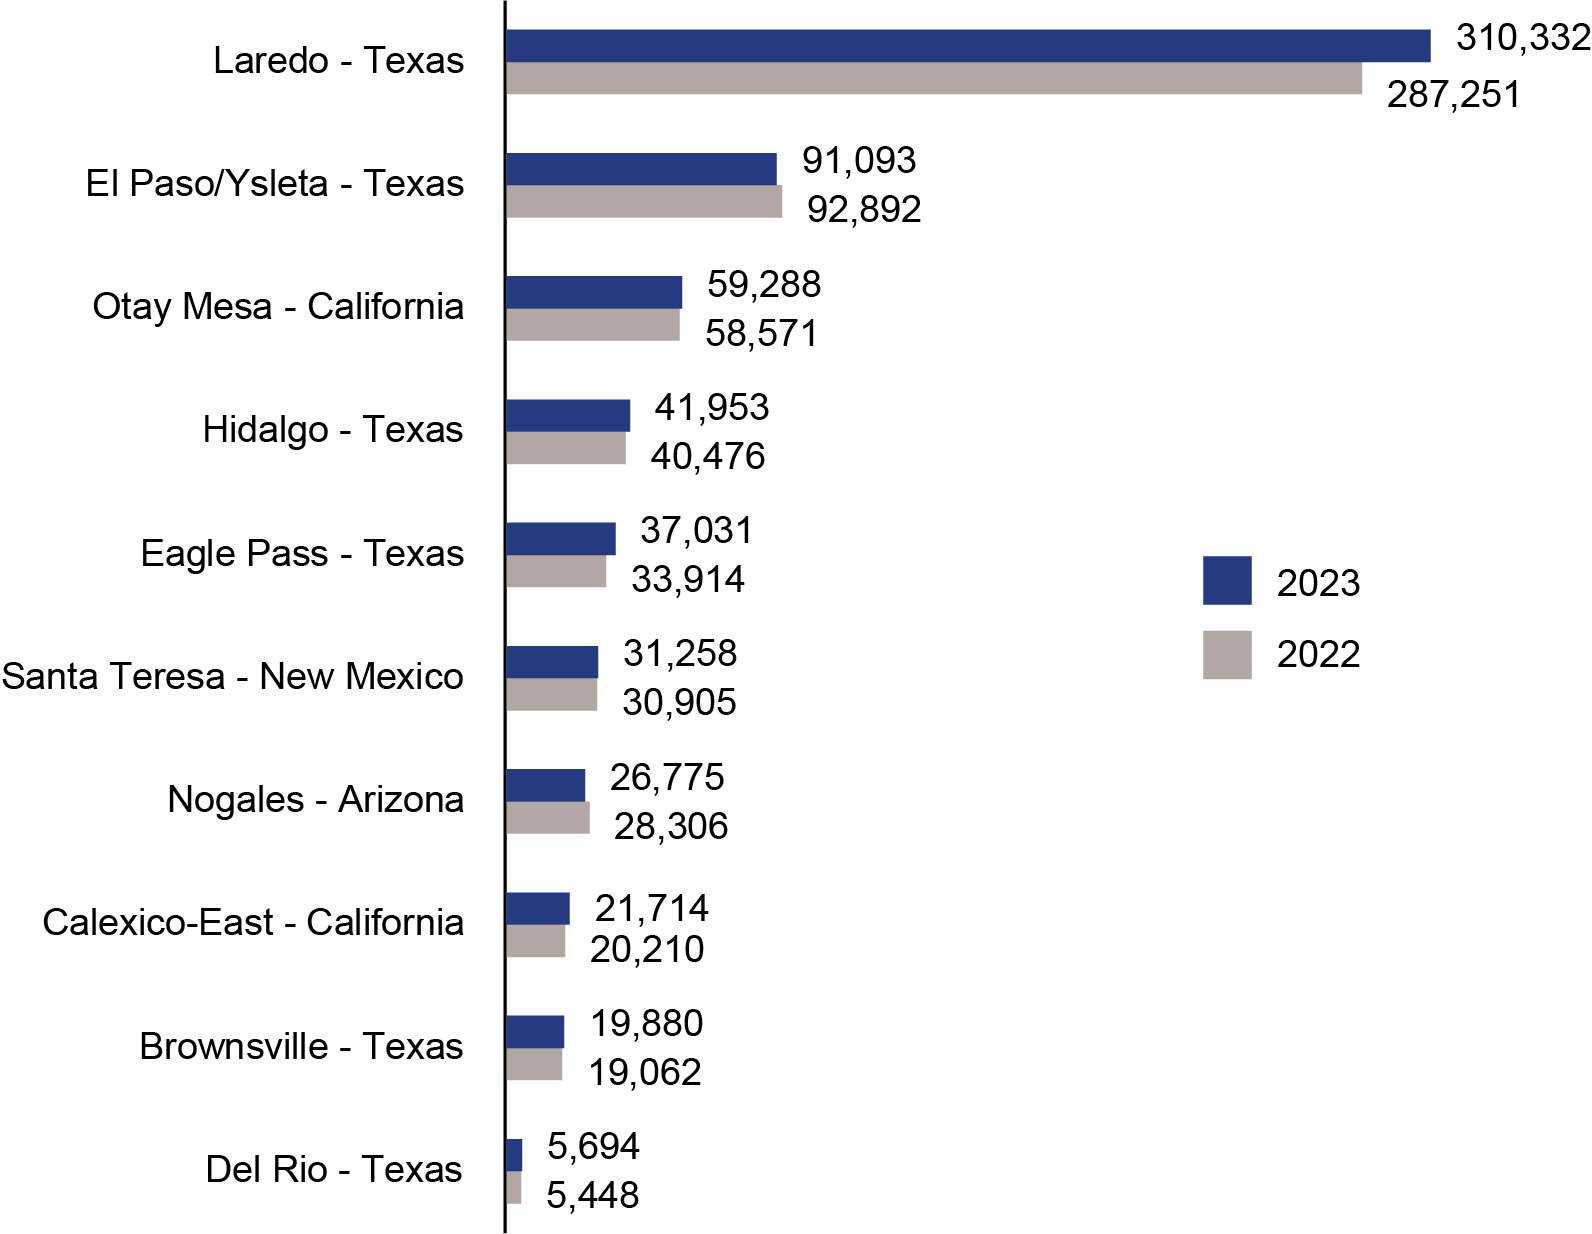
Source: Bureau of Transportation Statistics, Transborder Freight Data, available at https://data.bts.gov/stories/s/myhq-rm6q, adapted from U.S. Census Bureau, International Trade in Goods and Services
Top 10 Truck Ports along the U.S. - Mexico Border: 2022 - 2023 (Millions USD)
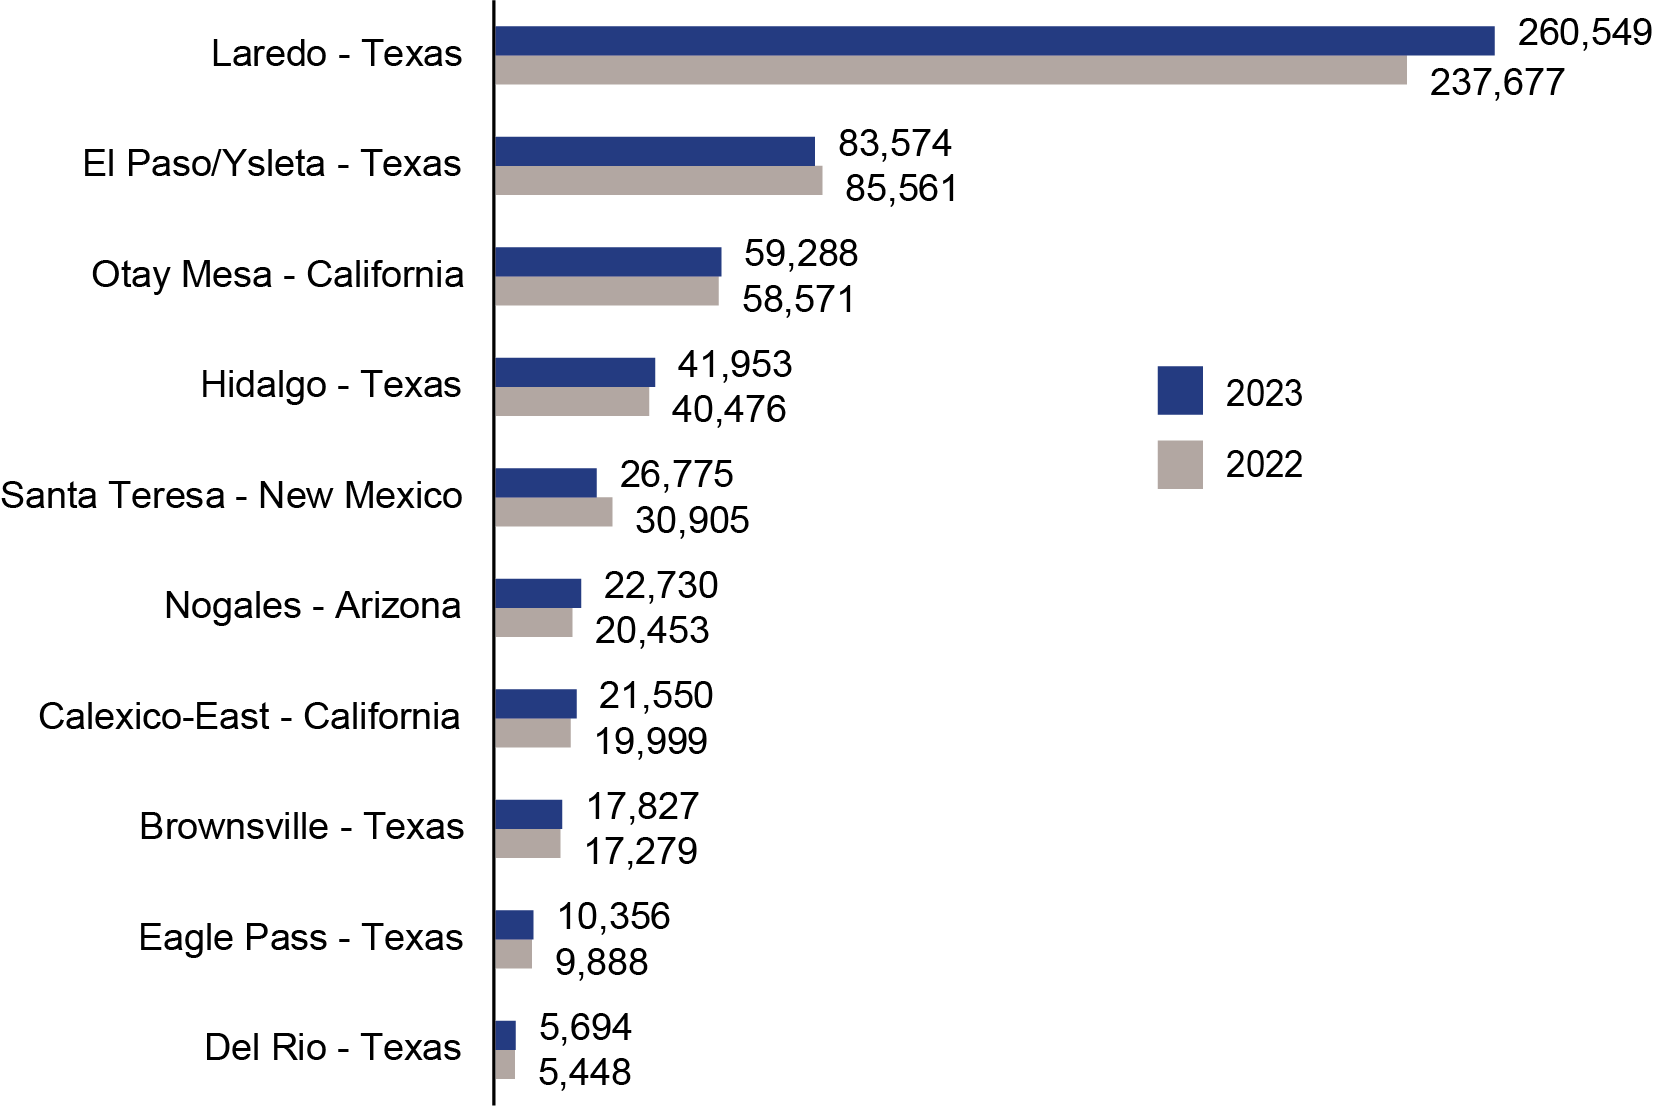
Source: Bureau of Transportation Statistics, Transborder Freight Data, available at https://data.bts.gov/stories/s/myhq-rm6q, adapted from U.S. Census Bureau, International Trade in Goods and Services
Top 10 Rail Ports along the U.S. - Mexico Border: 2022 - 2023
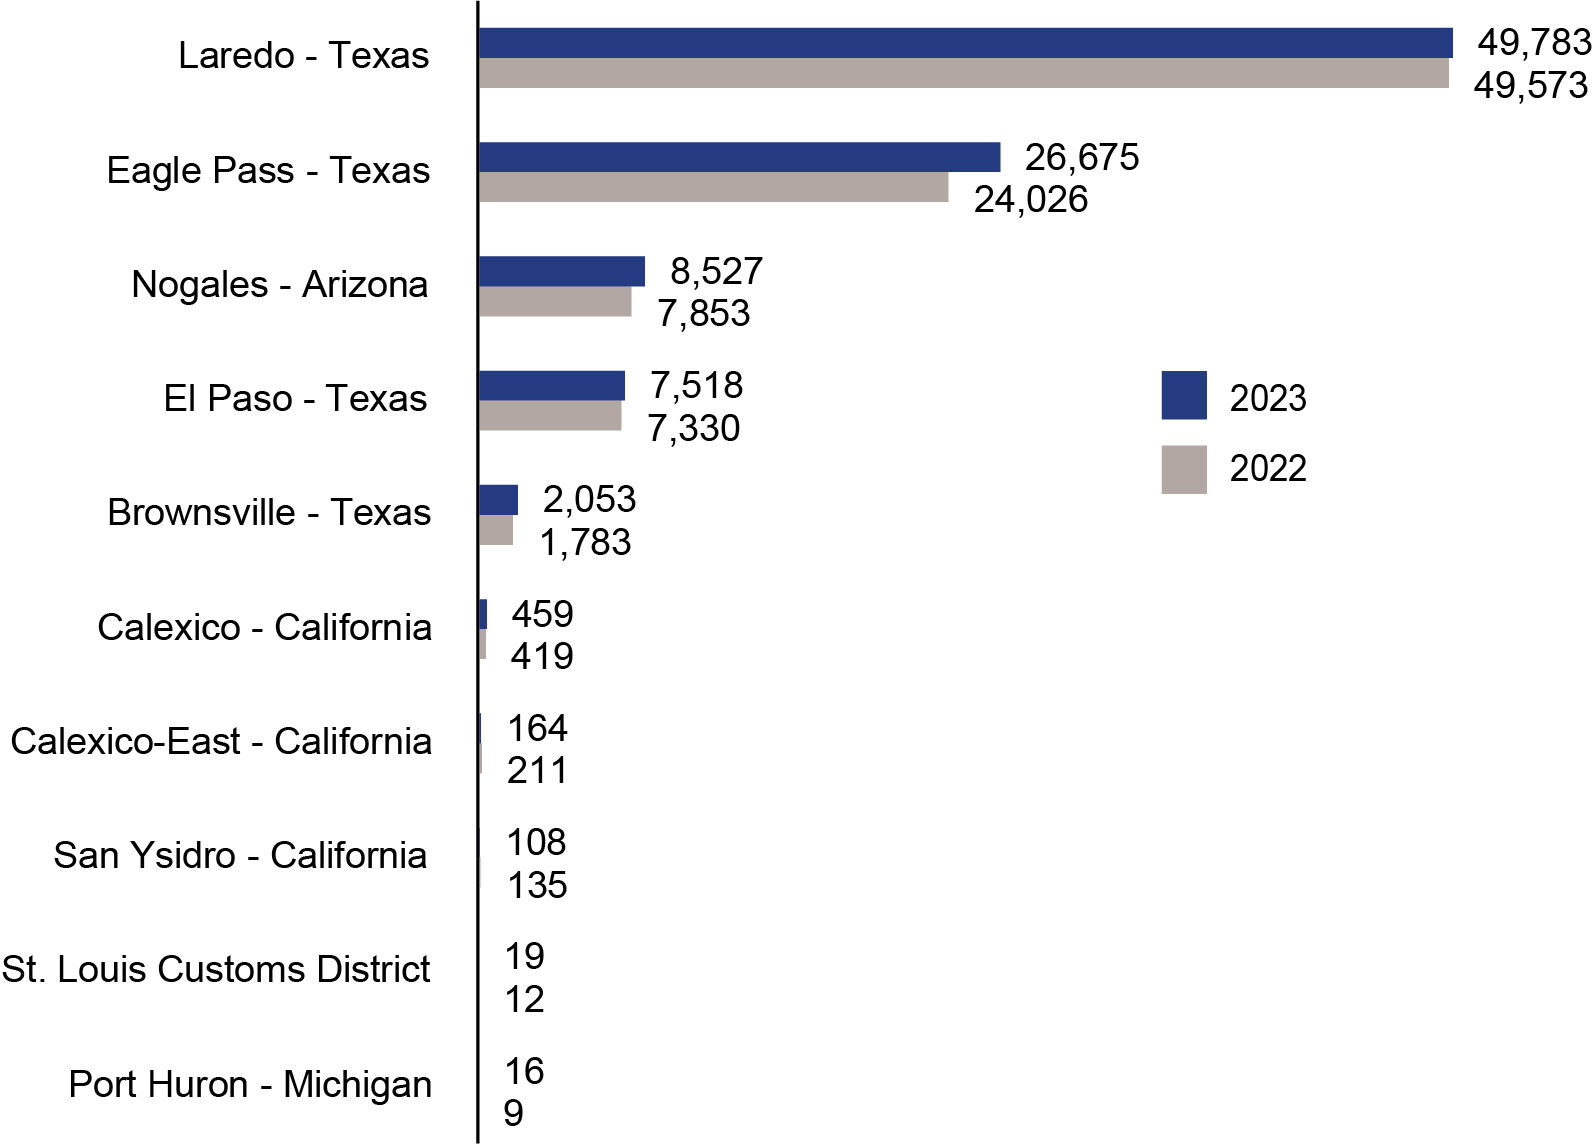
Note: Rail shipments from Mexico to St. Louis and Port Huron indicate CBP customs clearing districts.
Source: Bureau of Transportation Statistics, Transborder Freight Data, available at https://data.bts.gov/stories/s/myhq-rm6q, adapted from U.S. Census Bureau, International Trade in Goods and Services
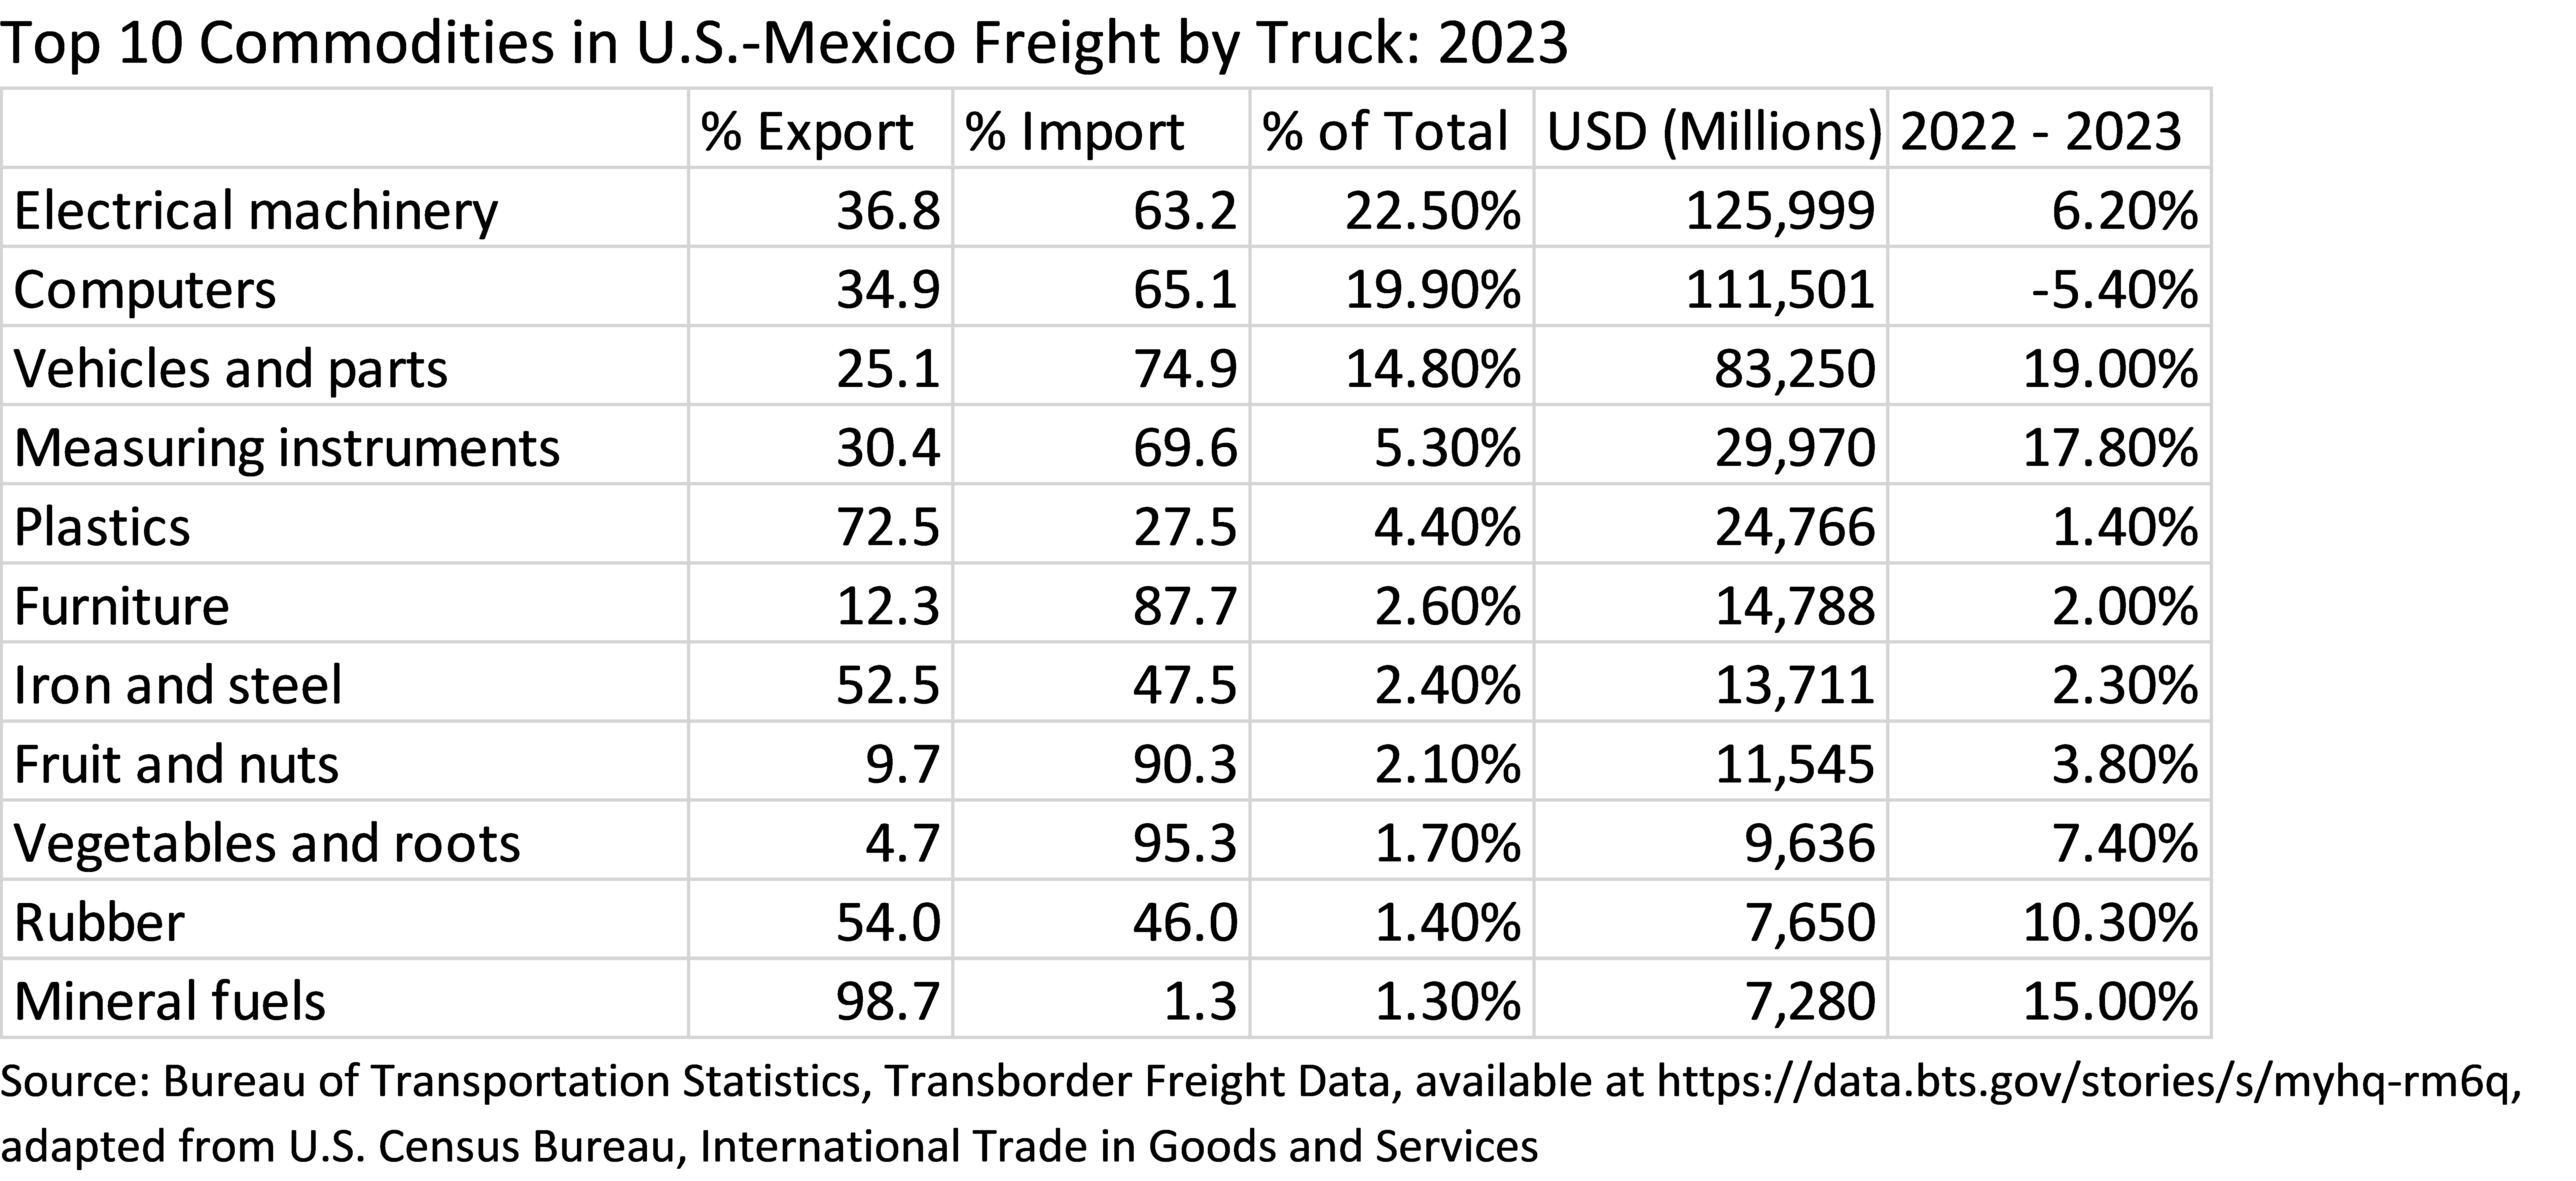
Top 10 Commodities in U.S.-Mexico Freight by Rail: 2023

Source: Bureau of Transportation Statistics, Transborder Freight Data, available at https://data.bts.gov/stories/s/myhq-rm6q, adapted from U.S. Census Bureau, International Trade in Goods and Services
Risk Assessment Ranking: Top U.S. - Mexico Freight Crossings: 2023
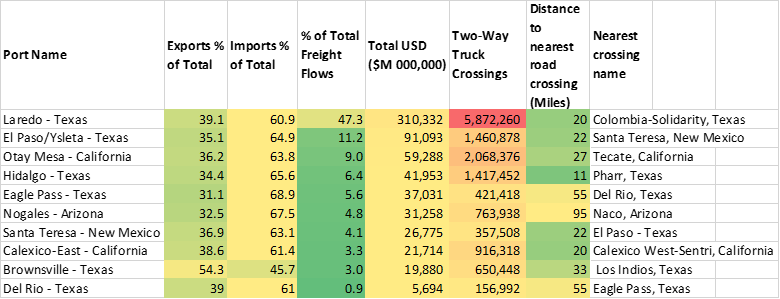
Note: Colors indicate risk levels: red is high, yellow is moderate, and green is low. Two-way truck crossing counts are estimates based on doubling of one-way counts.
Sources: Bureau of Transportation Statistics, Transborder Freight Data, available at https://data.bts.gov/stories/s/myhq-rm6q, adapted from U.S. Census Bureau, International Trade in Goods and Services, Bureau of Transportation Statistics, Border Crossing/Entry Data, available at https://data.bts.gov/stories/s/jswi-2e7b