
Employees at U.S. Scheduled Passenger Airlines Month of March, 1990-2019
March FTEs in thousands (000)
Figure
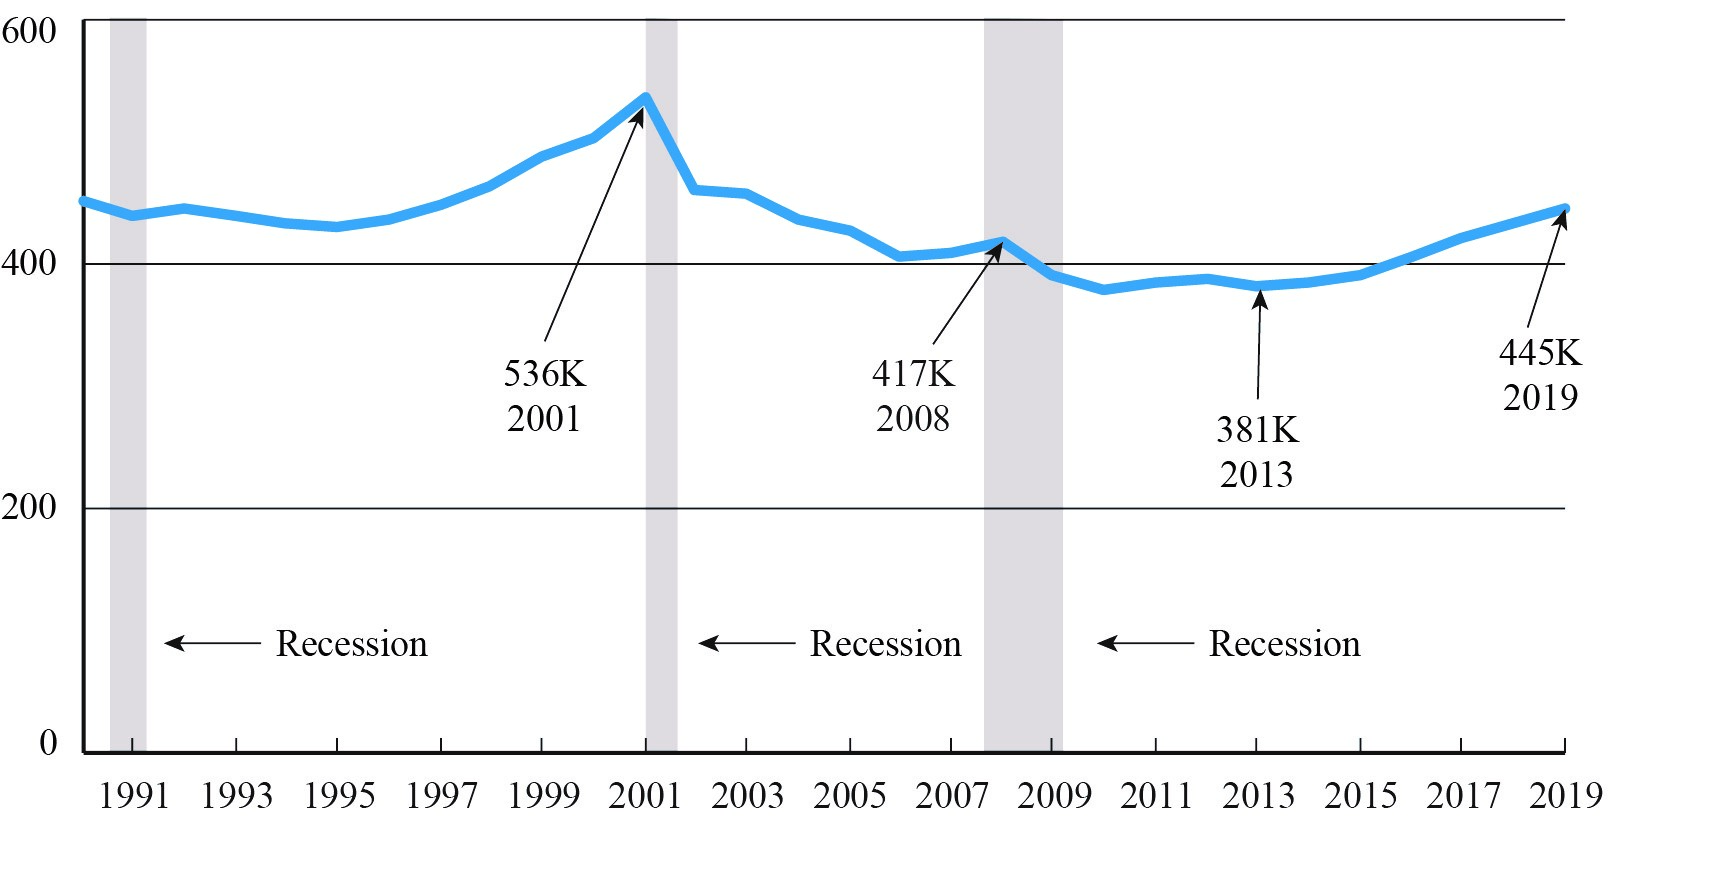
Dataset Table:
| March FTEs in thousands (000) | 1 | |
|---|---|---|
| 1990 | 450.0 | 2 |
| 1991 | 438.5 | 3 |
| 1992 | 444.8 | 4 |
| 1993 | 440.1 | 5 |
| 1994 | 433.7 | 6 |
| 1995 | 428.6 | 7 |
| 1996 | 436.2 | 8 |
| 1997 | 447.5 | 9 |
| 1998 | 463.9 | 10 |
| 1999 | 488.9 | 11 |
| 2000 | 501.9 | 12 |
| 2001 | 536.3 | 13 |
| 2002 | 461.4 | 14 |
| 2003 | 458.6 | 15 |
| 2004 | 436.7 | 16 |
| 2005 | 427.1 | 17 |
| 2006 | 404.4 | 18 |
| 2007 | 407.5 | 19 |
| 2008 | 416.9 | 20 |
| 2009 | 392.1 | 21 |
| 2010 | 377.8 | 22 |
| 2011 | 383.3 | 23 |
| 2012 | 388.1 | 24 |
| 2013 | 380.5 | 25 |
| 2014 | 383.6 | 26 |
| 2015 | 390.8 | 27 |
| 2016 | 406.0 | 28 |
| 2017 | 422.3 | 29 |
| 2018 | 434.2 | 30 |
| 2019 | 445.0 | 31 |
| 32 |
Notes:
FTE calculations count two part-time employees as one full-time employee.
Source:
Bureau of Transportation Statistics