
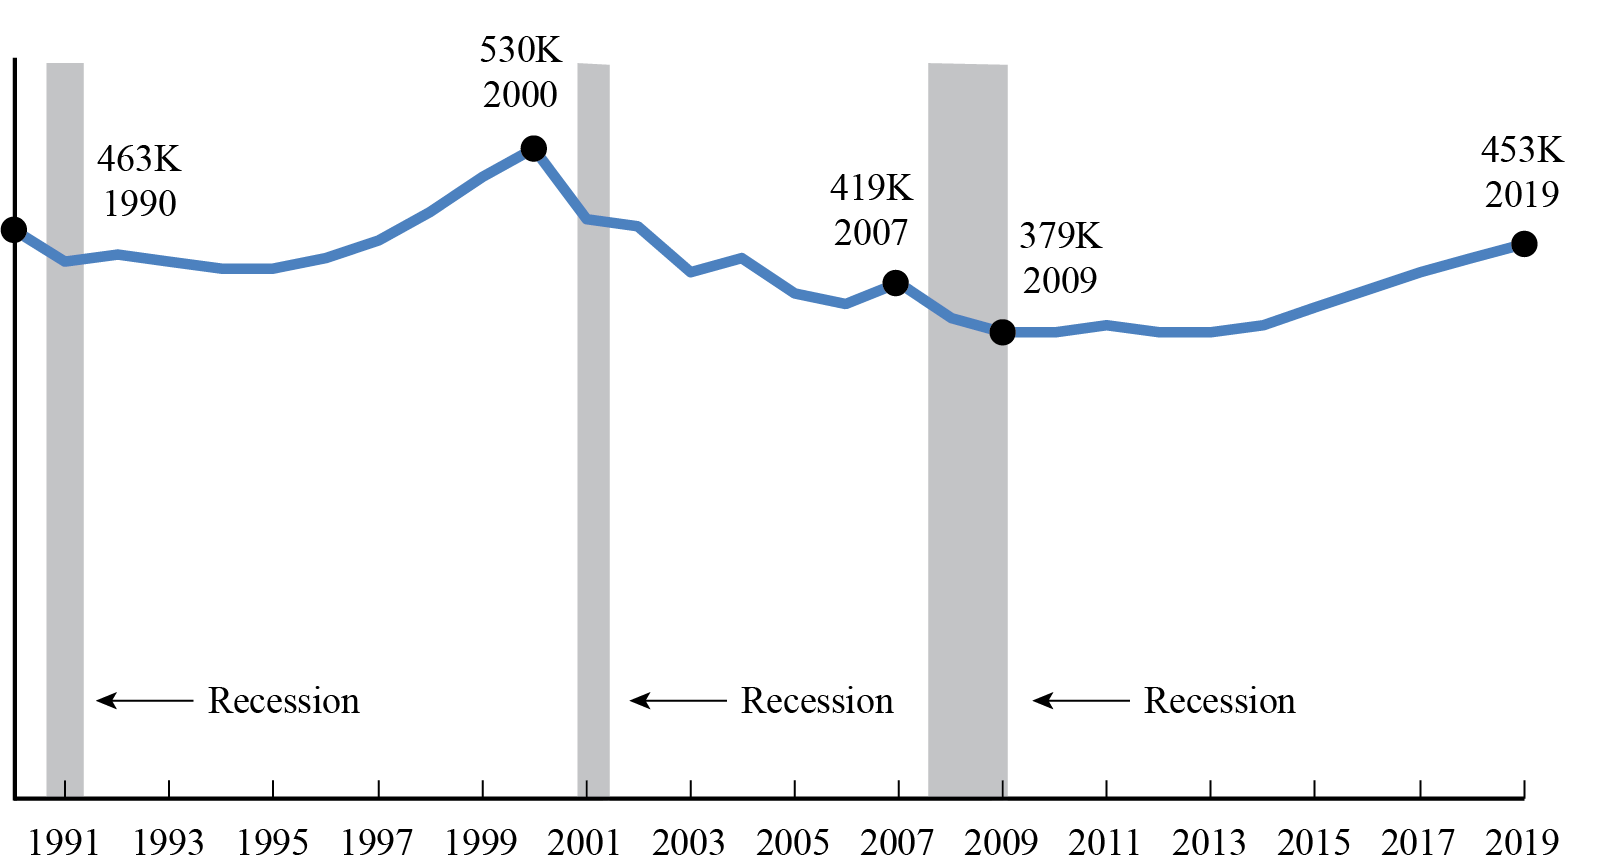
Employees at U.S. Scheduled Passenger Airlines Month of November, 1990-2019
(Full-Time Equivalents)
Figure
Dataset Table:
| Year | November FTEs in thousands (000) | 1 |
|---|---|---|
| 1990 | 463.3 | 2 |
| 1991 | 437.3 | 3 |
| 1992 | 444.4 | 4 |
| 1993 | 438.9 | 5 |
| 1994 | 431.9 | 6 |
| 1995 | 432.6 | 7 |
| 1996 | 442.1 | 8 |
| 1997 | 456.1 | 9 |
| 1998 | 479.5 | 10 |
| 1999 | 506.1 | 11 |
| 2000 | 529.7 | 12 |
| 2001 | 472.7 | 13 |
| 2002 | 466.6 | 14 |
| 2003 | 430.4 | 15 |
| 2004 | 439.8 | 16 |
| 2005 | 410.7 | 17 |
| 2006 | 403.7 | 18 |
| 2007 | 419.3 | 19 |
| 2008 | 392.1 | 20 |
| 2009 | 379.4 | 21 |
| 2010 | 380.2 | 22 |
| 2011 | 386.6 | 23 |
| 2012 | 381.1 | 24 |
| 2013 | 381.2 | 25 |
| 2014 | 386.9 | 26 |
| 2015 | 401.3 | 27 |
| 2016 | 416.0 | 28 |
| 2017 | 429.9 | 29 |
| 2018 | 439.9 | 30 |
| 2019 | 452.7 | 31 |
Notes:
FTE calculations count two part-time employees as one full-time employee.
Source:
Bureau of Transportation Statistics