


Increases in Highway Construction Costs Reduced the Economic Value of Transportation’s IIJA Funding by 32 Percent From FY 2022 to 2025: An Analysis of Potential Reductions in 2026
Rising construction costs reduce what recipients of transportation-funding bills can purchase. This brief assesses the impact of those costs on highway funding from the Infrastructure Investment and Jobs Act (IIJA) (Public Law 117-58). Between fiscal year (FY) 2022 and FY 2026, IIJA provided $673.8 billion for roads, bridges, transit, airports, and rail. Highway infrastructure received the largest share ($379.3 billion, or 56 percent) of that funding. Though IIJA provided about 20 percent of the total funding each year, recipients implemented fewer infrastructure improvements over time because rising costs reduced their buying power.
This brief is an update to the Bureau of Transportation Statistics’ (BTS’) initial look at IIJA recipients’ reduction in buying power for highway projects [BTS 2024]. In the previous brief, BTS measured the reduction in the buying power of IIJA highway funds for calendar year (CY) 2022 and predicted it for CY 2023 to 2026 using highway construction cost data through CY 2022. With highway construction cost data now available through FY 2025, this brief realigns the estimates with the FY calendar for IIJA, measures the actual reduction in the buying power for IIJA highway funds for FY 2022 through 2025, and estimates the reduction in the remaining year, FY 2026, assuming highway construction costs increase linearly by how much they grew from FY 2024 to 2025. This brief also compares BTS’ initial estimates [BTS 2024], for FY 2023 through FY 2025, to the actual reductions in the buying power of IIJA highway funds, in the “Comparison to Previous Prediction for FY 2023 Through 2025” section. For further information about the highway construction cost data used in this brief, refer to the “Data Sources and Further Information” section.
The most recent National Highway Construction Cost Index (NHCCI) data show that increases in highway construction costs reduced IIJA funds by 32 percent from FY 2022 to 2025. The large reduction follows from highway construction costs reaching a historic high in FY 2022, with the average quarterly index growing 24 percent from FY 2021 to 2022 [FHWA n.d.]. Inflation of highway construction costs slowed substantially in FY 2025, growing at the slowest average annual rate (0.6 percent) since 2017 [FHWA n.d.]. Assuming construction costs grow at the same rate (0.6 percent) in FY 2026, highway construction costs would reduce IIJA funds allocated for highway by 39 percent in FY 2026 (Figure 1). In other words, the $78.8 billion (in 2021 USD) authorized by IIJA for spending on highways in FY 2026 could buy only $48.0 billion worth of highway construction due to highway construction cost inflation. In total, highway construction cost increases would reduce the value of IIJA funds for highways by 34 percent from FY 2022 to 2026.
Figure 1. IIJA Funding Authorized for Highway Infrastructure by Fiscal Year and Amount Reduced by
Highway Construction Cost Inflation
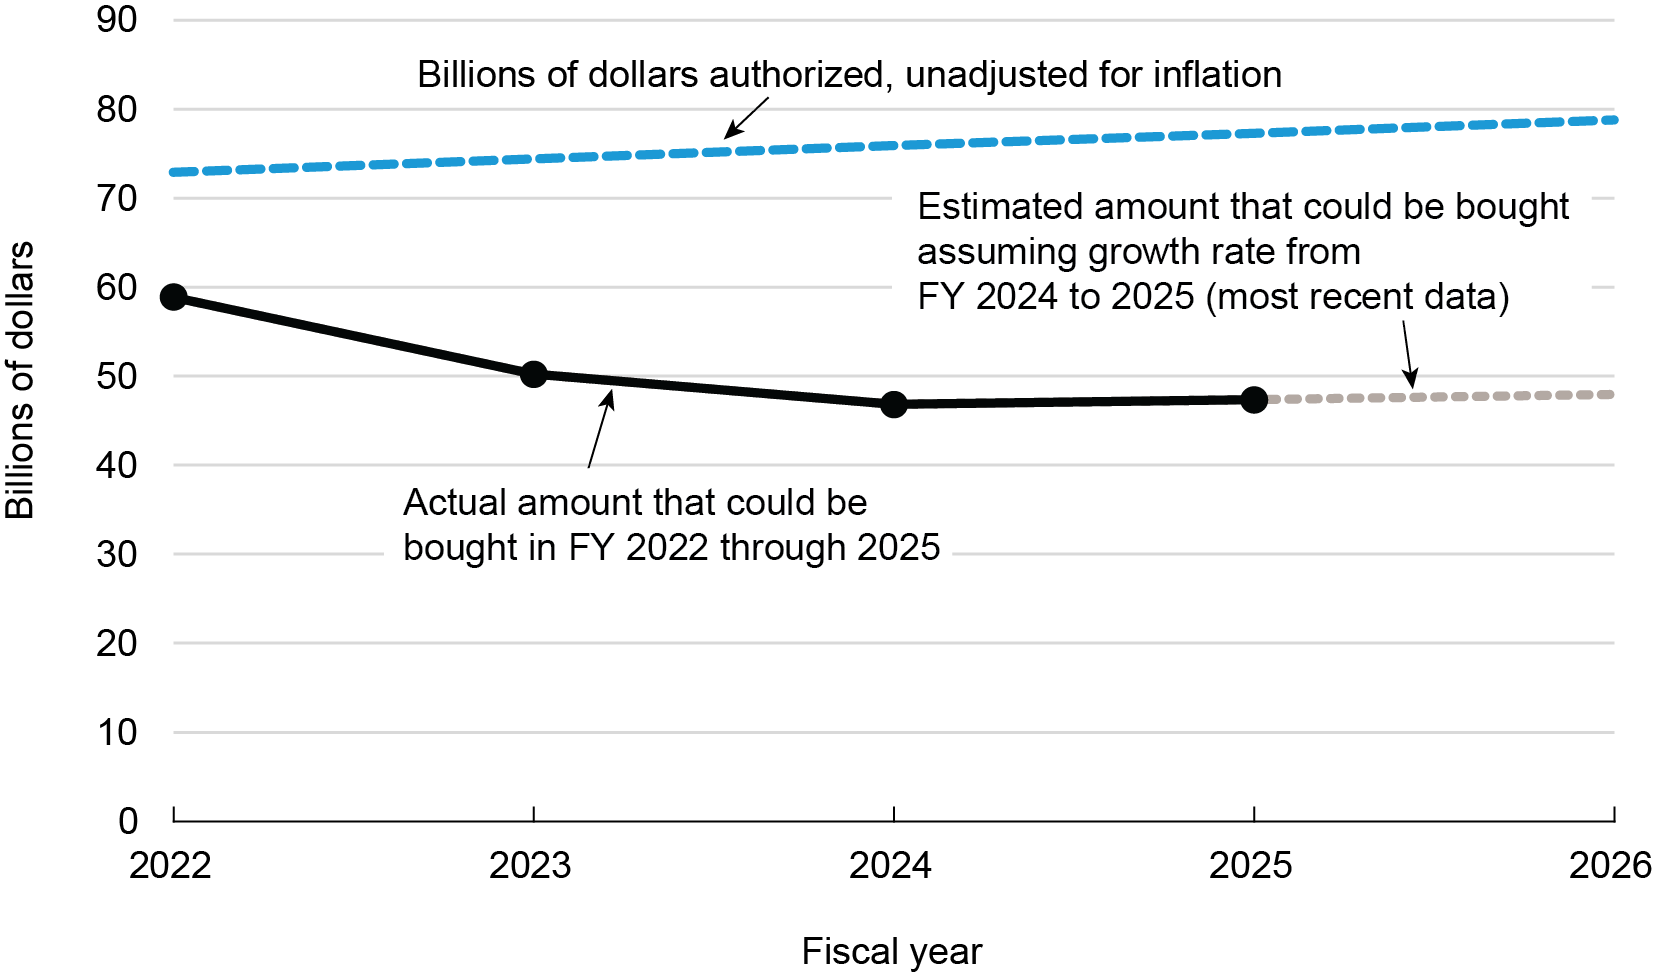
Note: BTS calculated the reduction in highway construction that could be funded by multiplying the amount authorized for highway construction in each fiscal year by one minus the average quarterly National Highway Construction Cost Index (NHCCI) in 2021 divided by the NHCCI in the same year. For example, IIJA authorized $74.4 billion in 2023. Multiplying this by 1-(2.1/3.0) (the average quarterly NHCCI in 2021 relative to 2023) yields the reduction from highway construction cost inflation ($23.6 billion) and subtracting from $74.4 billion yields the amount that could be bought ($50.8 billion) after highway construction cost inflation. For FY 2025 and 2026, BTS used the average quarterly NHCCI in 2024 (3.2) in this equation.
Source: BTS, data from BTS n.d. and FHWA n.d.
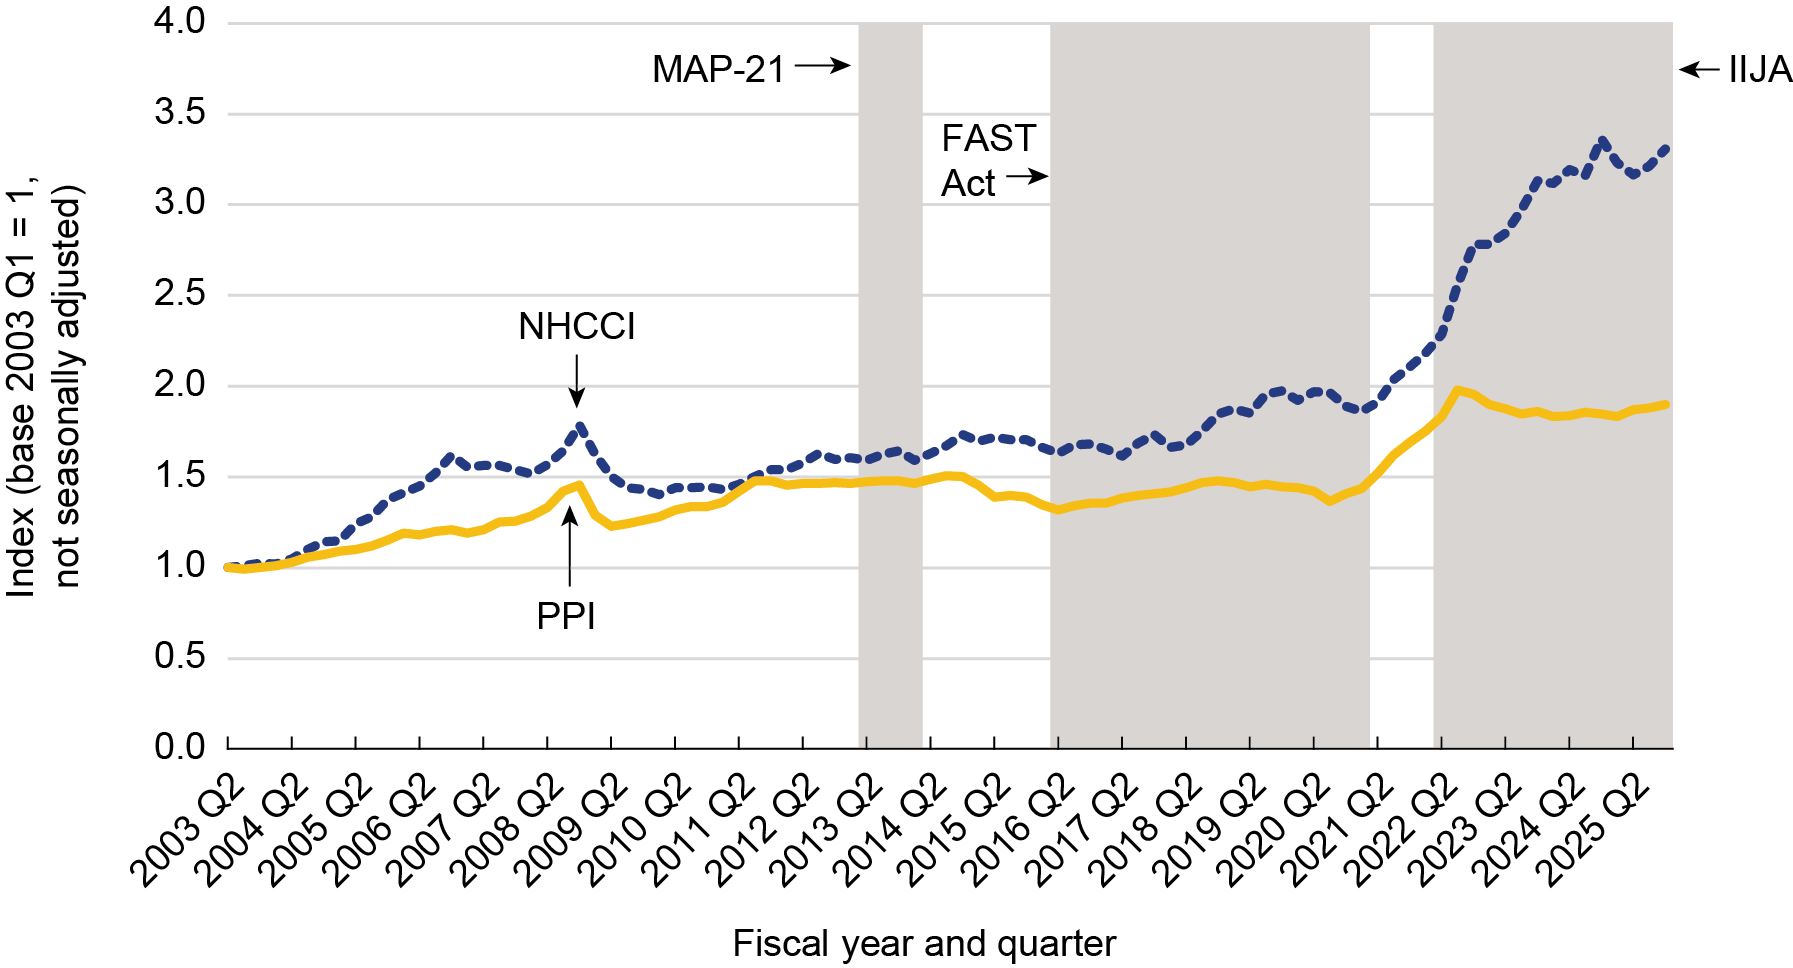
Highway construction costs increased more during IIJA years than during the years of previous highway funding. During the funding period for the Moving Ahead for Progress in the 21st Century Act (MAP-21), which authorized funding for transportation programs from FY 2013 to FY 2015, highway construction costs increased 6 percent, averaging a growth of 2 percent per FY (Figure 2). During the funding period for the Fixing America’s Surface Transportation (FAST) Act, highway construction costs increased 16 percent from FY 2016 to 2020; averaging a growth of 3 percent per FY. In contrast, during IIJA’s funding period, highway construction costs increased 32 percent from FY 2022 through 2025 (the most recent FY with complete data) and averaged a growth of 13 percent per FY. As such, highway construction costs increases during IIJA have been unprecedented and have reduced what could be bought with authorized monies more than in any previous funding period.
Figure 2. National Highway Construction Cost Index (NHCCI) and Producer Price Index (PPI)
Source: BTS, data from FHWA n.d. and BLS n.d.
The most recent data show a possible plateau in the growth of highway construction costs. After increasing 24 percent from FY 2021 to 2022, highway construction costs rose by 20 percent from FY 2022 to 2023, rose 9 percent from FY 2023 to 2024, and then increased only 0.6 percent from FY 2024 to 2025 [FHWA n.d.]. Overall, highway construction costs grew 63 percent from FY 2021 to 2025 [FHWA n.d.], which has reduced the amount of highway infrastructure that funding recipients can buy. In other words, the same construction project today costs more than yesterday and significantly more than in 2021.
Supply chain issues contributed to the rise in highway construction costs. Supply chain issues began in 2020, when COVID-19 caused temporary and permanent business closures and increased demand for durable goods [Tauber, K. and W. Van Zandweghe 2021]. This demand, in turn, caused material prices to rise. The producer price index for all goods and services measures changes in material prices as the average change over time in the selling prices received by producers for their commodities. In other words, the overall PPI measures the prices faced by businesses purchasing goods and services. Not adjusted for seasonality, the overall PPI grew by 45 percent from the third quarter of FY 2020 (the lowest point before rising significantly) to a new all-time high in the third quarter of FY 2022 (Figure 2). The overall PPI declined 7 percent from third quarter of FY 2022 through the first quarter of FY 2024, then remained relatively unchanged until rising from the first quarter to the fourth quarter of FY 2025 by 4 percent [BLS n.d.]. Highway construction costs rose less than the overall PPI from the third quarter of FY 2020 to the third quarter of FY 2022 (30 percent) and grew by 22 percent, rather than declining, from the third quarter of FY 2022 to the first quarter of FY 2024 [FHWA n.d.]. Highway construction costs then rose slightly less than the overall PPI from the first to the last quarter of FY 2025 (2 percent versus 4 percent) [BLS n.d. and FHWA n.d.]. Highway construction costs reflect the actual highway project costs for material, labor, and so on, while the overall PPI tracks the selling prices of raw materials. For this reason, changes in the selling prices of raw materials, as measured by the PPI, influence highway construction costs but are not the only determinant of highway project costs, which results in the observed divergent trends between the PPI and the NHCCI.
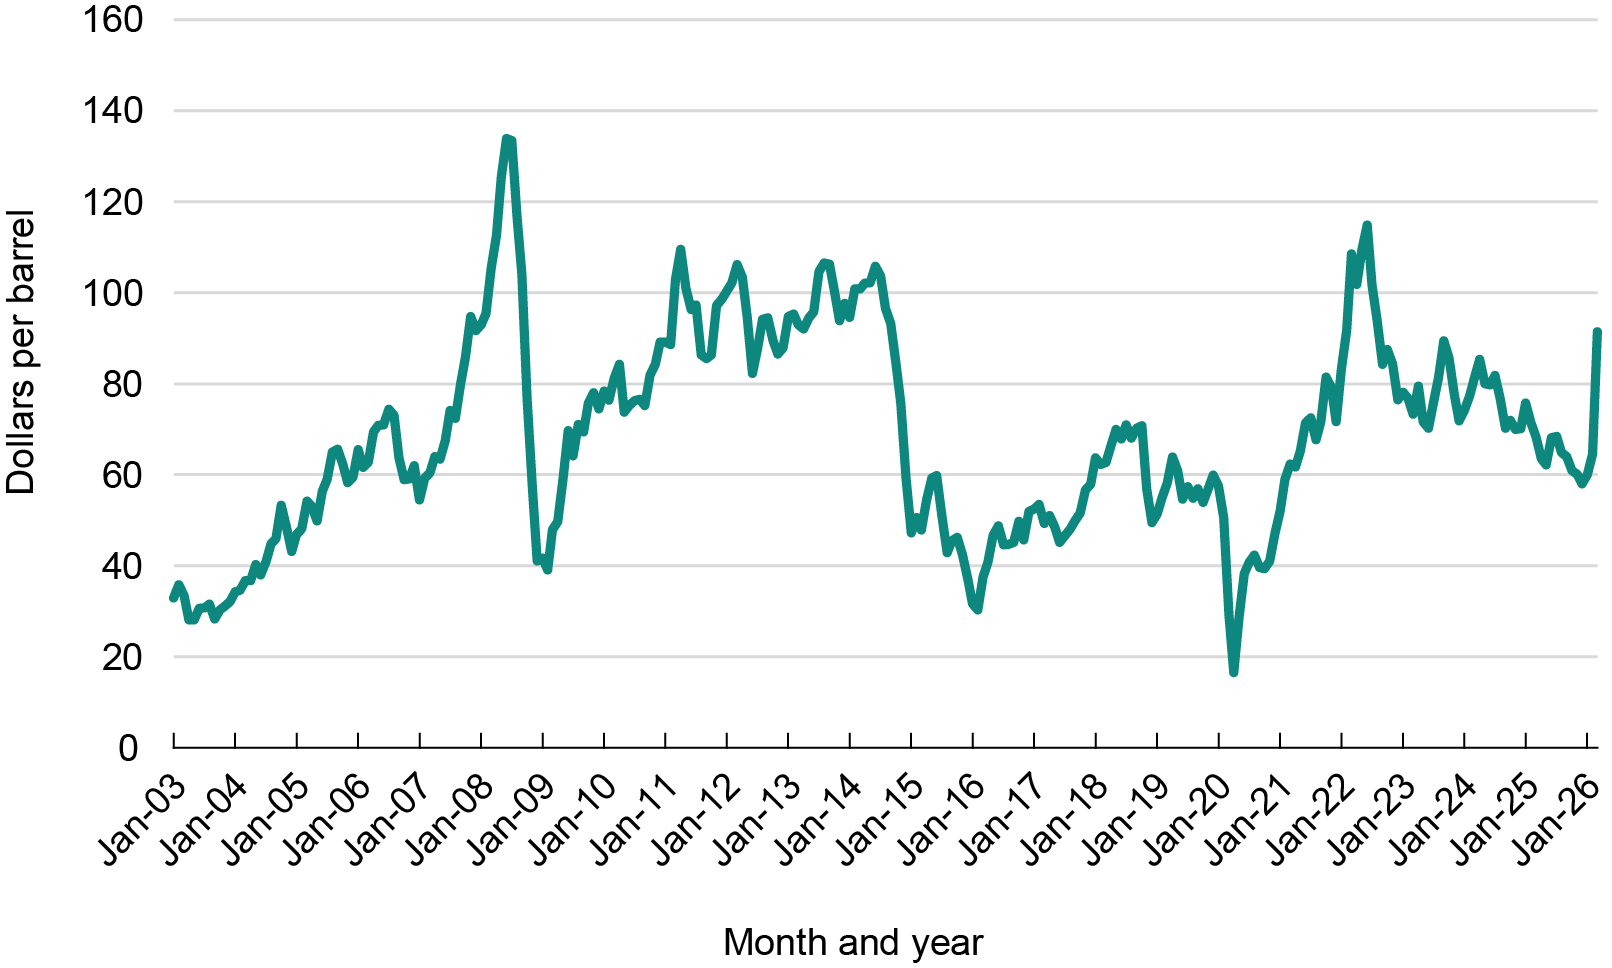
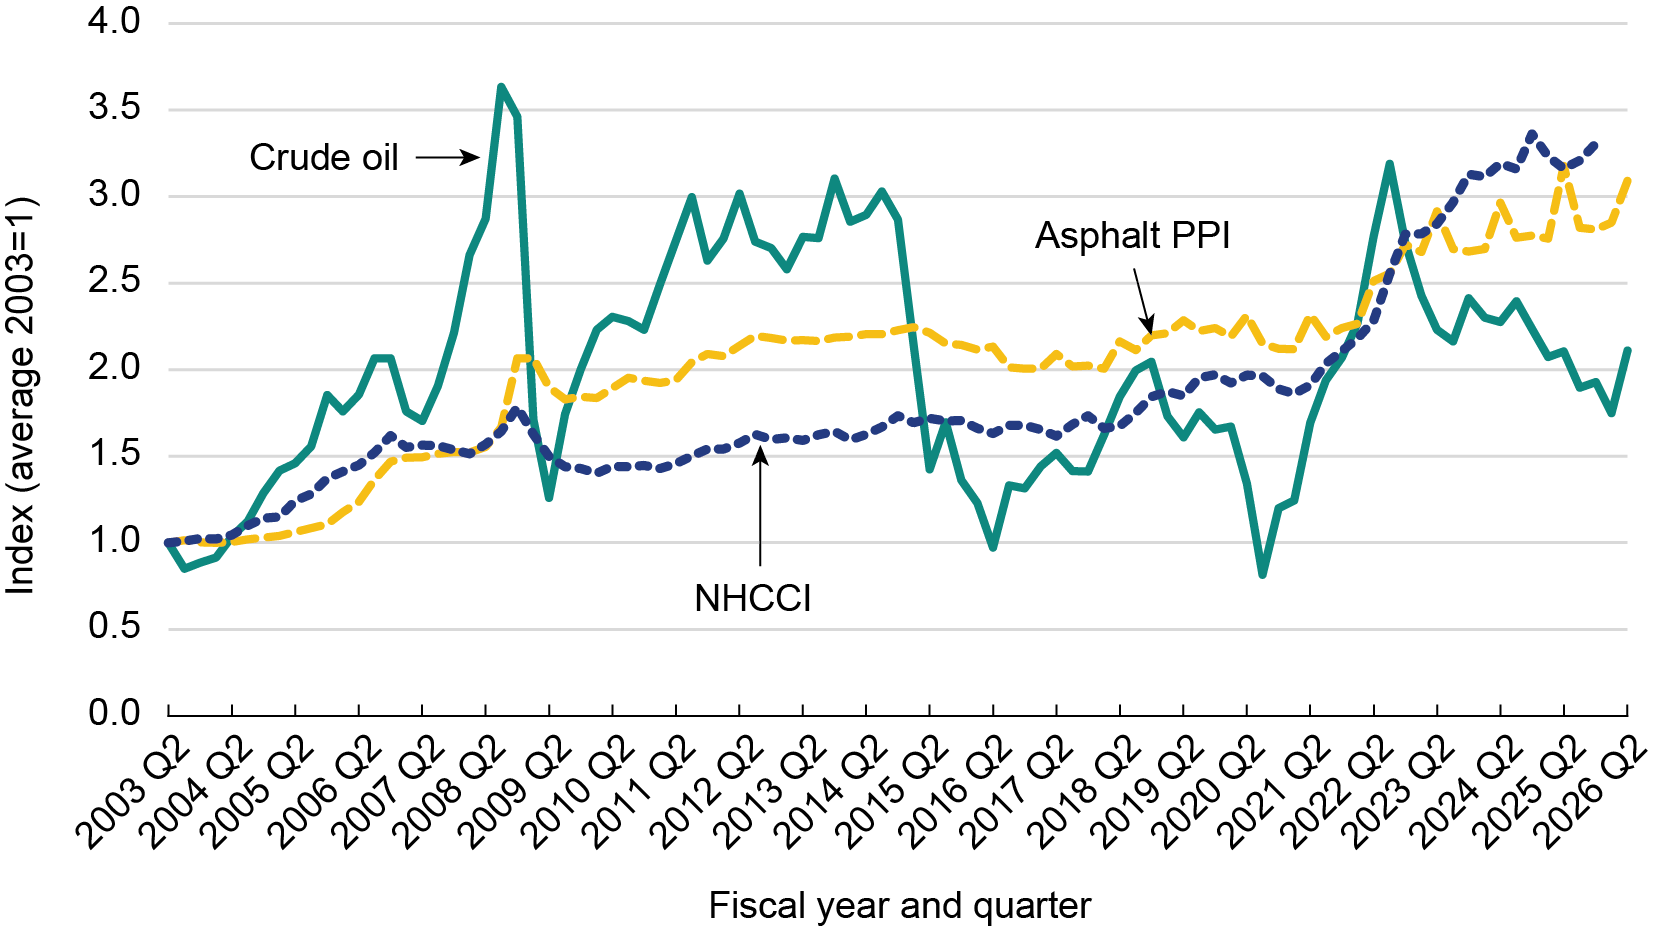
Increases in the cost of crude oil, a component of asphalt, also contributed to highway construction cost increases. U.S. crude oil costs increased 594 percent, from a low of $16.55 per barrel in April 2020 to the second highest price on record, $114.84 per barrel in June 2022 (Figure 3).1 The rise in crude oil prices resulted in asphalt becoming the top contributor to quarterly increases in highway construction costs from the first through the fourth quarter of FY 2022 (October 2021–September 2022) (Figure 4). Crude oil prices fell from the June 2022 high but then rose from June to September 2023 by 27 percent. The June to September 2023 rise in crude oil prices once again corresponded with asphalt becoming the top contributor to quarterly highway construction cost growth in the third quarter of FY 2023 (April–June 2023) through the first quarter of FY 2024 (October–December 2023) [FHWA n.d.]. While asphalt remained the top contributor to quarterly highway construction cost growth in the first quarter of FY 2024, crude oil prices began to fall slightly prior, declining 35 percent from September 2023 through December 2025 (Figure 3). The fall in crude oil prices resulted in asphalt being replaced as the top contributor to quarterly increases in highway construction costs in the second quarter of FY 2024. Grading and excavation contributed the most in the third and fourth quarter of FY 2024, but otherwise, no item has persistently contributed to highway construction cost increases [FHWA n.d.].
Figure 3. U.S. Crude Oil Prices
Source: BTS, data from EIA n.d.
Figure 4. Top Three Contributors to Quarterly Growth in Construction Costs
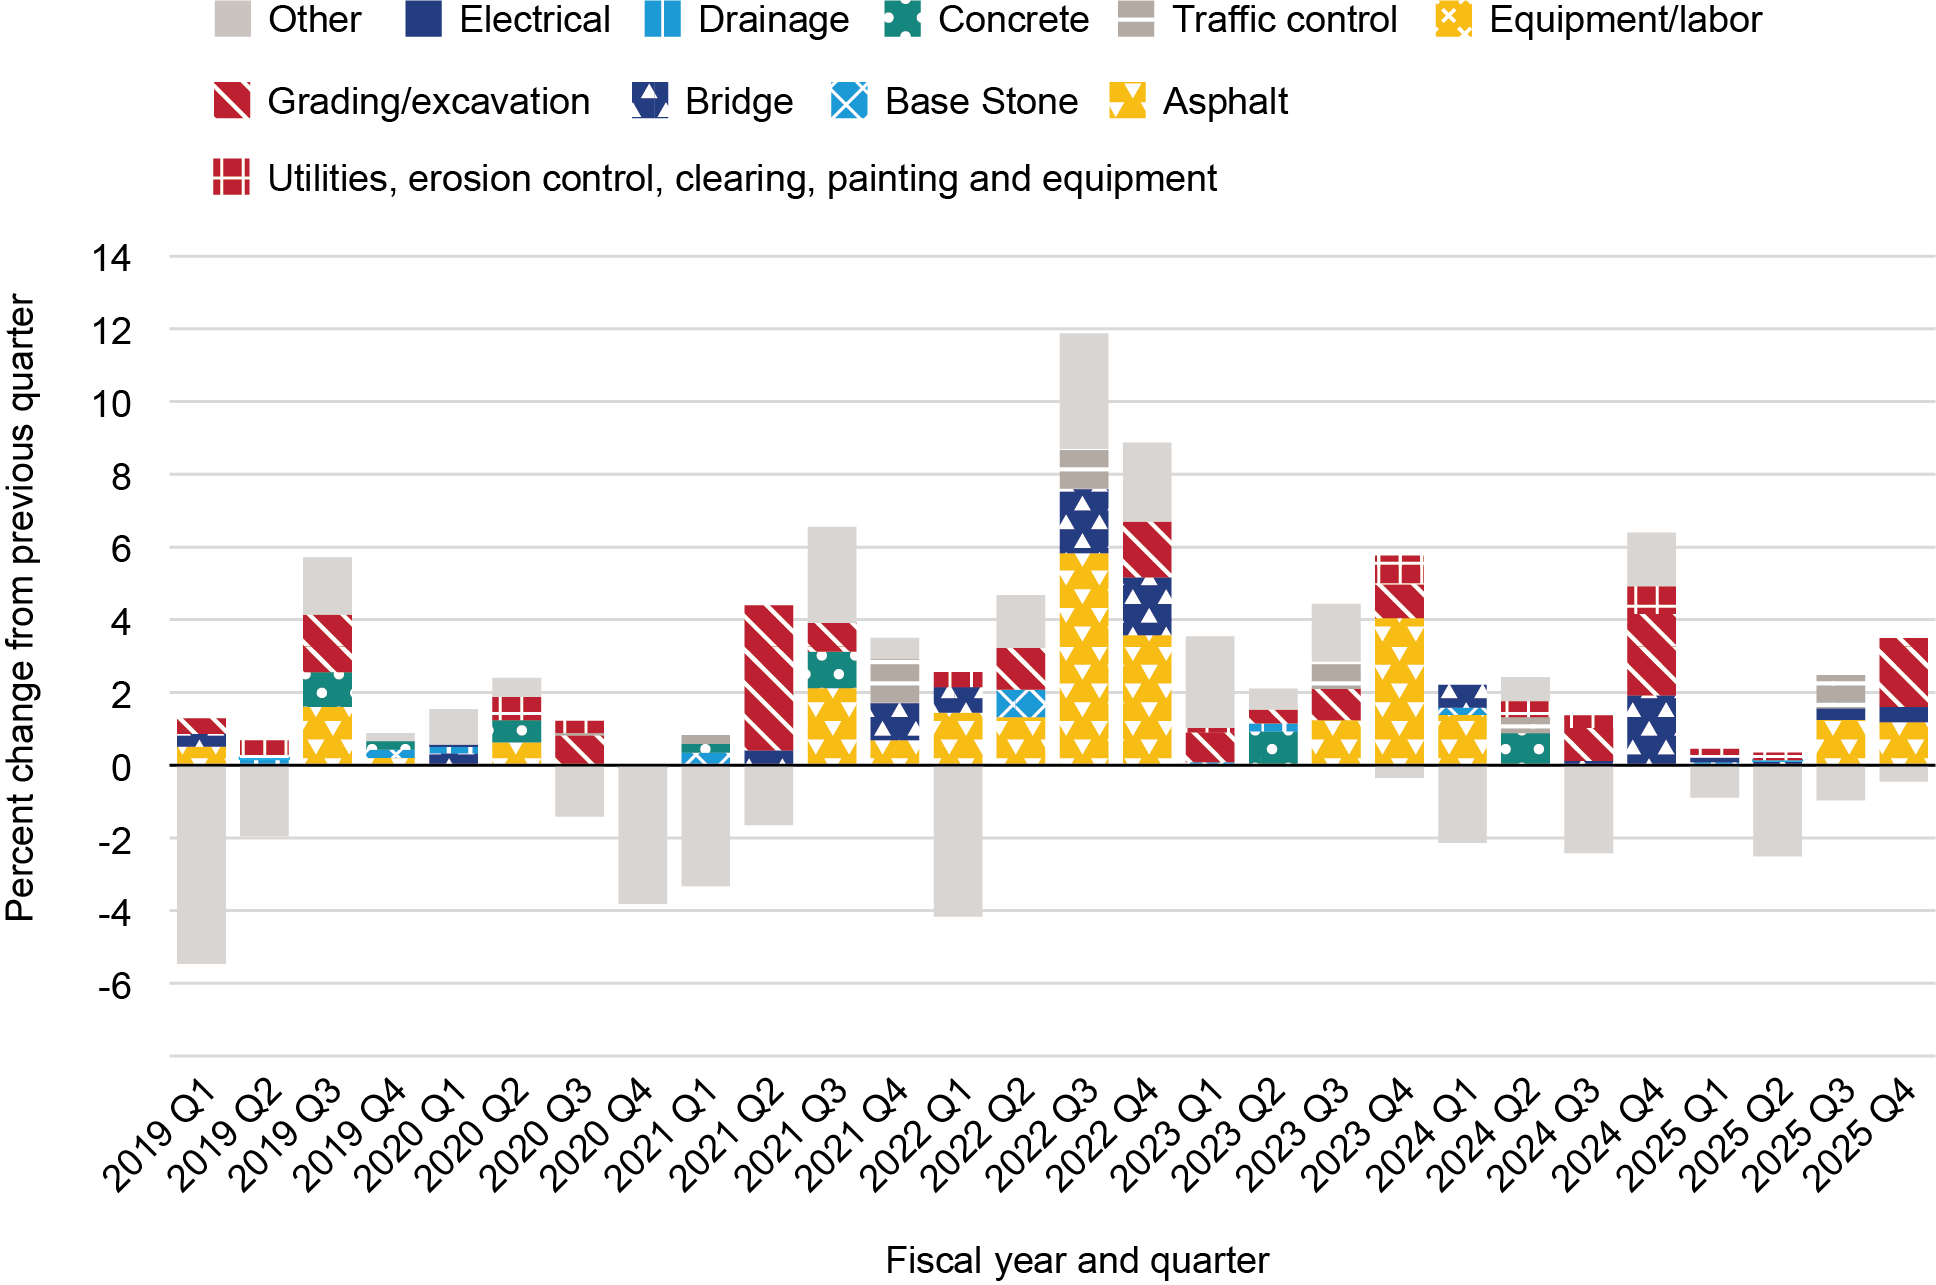
Note: The total percent change from the previous quarter is the sum of all components.
Source: BTS, data from FHWA n.d.
Increases in crude oil prices in 2026 may alter the predicted trajectory of highway construction cost growth. Crude oil prices increased 42 percent from February to March 2026—the second largest monthly increase from January 2003 to March 2026 [EIA n.d.]. The increase pushed crude oil prices 2 percent above the September 2023 peak, but the March 2026 price remains 20 percent below the June 2022 price (not adjusted for inflation) [EIA n.d.]. Highway construction cost data are not yet available for the first two quarters of FY 2026 (October 2025–March 2026) and thus it remains to be seen whether the increase in crude oil will cause significant growth in the cost of asphalt and in highway construction costs. The PPI for asphalt serves as a proxy for how the cost of asphalt may contribute to highway construction costs. The PPI for asphalt rose 8 percent from the first to the second quarter of FY 2026, rising to nearly its value in the second quarter of FY 2025 (Figure 5). In the second quarter of FY 2025, asphalt was not one of the top three contributors to quarterly increases in highway construction costs, but it was the top in the following quarter— the third quarter of FY 2025 [FHWA n.d.]. Although asphalt was the top contributor in the third quarter of FY 2025, it did not contribute to record high quarterly growth in the NHCCI like it did in the third quarter of FY 2022 [FHWA n.d.]. From the second to the third quarter of FY 2025, asphalt contributed 1.3 percentage points toward a 1.5 percent growth in highway construction costs, whereas from the second to the third quarter of 2022, asphalt contributed 5.8 percentage points toward an 11.9 percent growth in highway construction costs [FHWA n.d.]. This suggests that crude oil prices may cause asphalt to become the top contributor to quarterly growth in highway construction costs in the quarters following the increase (as occurred in FY 2025), but the increase may not cause record high growth in highway construction costs. However, continued growth in crude oil prices may once again increase asphalt and thereby highway construction costs, and if that occurs in FY 2026, the buying power of IIJA funds would be reduced further.
Figure 5. Crude Oil Price, National Highway Construction Cost Index (NHCCI), and Producer Price
Index (PPI)
Source: BTS, data from FHWA n.d., BLS n.d., and EIA n.d.
COMPARISON TO PREVIOUS PREDICTION FOR FY 2023 THROUGH 2025
In the previous brief [BTS 2024], under the first scenario (referred to as the High Inflation Scenario), BTS assumed highway construction costs continued to rise at the average growth rate from the most recent 2 years of data (FY 2021 and 2022).2 Under this High Inflation Scenario, re-aligned in this brief to fiscal years, BTS found only $242.2 billion (64 percent) (in 2021 USD) could be bought with the $379.3 billion allotted for highways from FY 2022 to 2026.
In the second, previously published scenario, the Modest Inflation Scenario, BTS assumes, construction costs equal the average annual growth in FY 2019 and 2021.3 Under this more modest growth scenario, only $271.6 billion (72 percent) (in 2021 USD) could be bought with the $379.3 billion authorized for highways from FY 2022 to 2026 due to highway construction cost inflation. Compared to the High Inflation Scenario, $29.4 billion (in 2021 USD) more could be bought under the Modest Inflation Scenario.
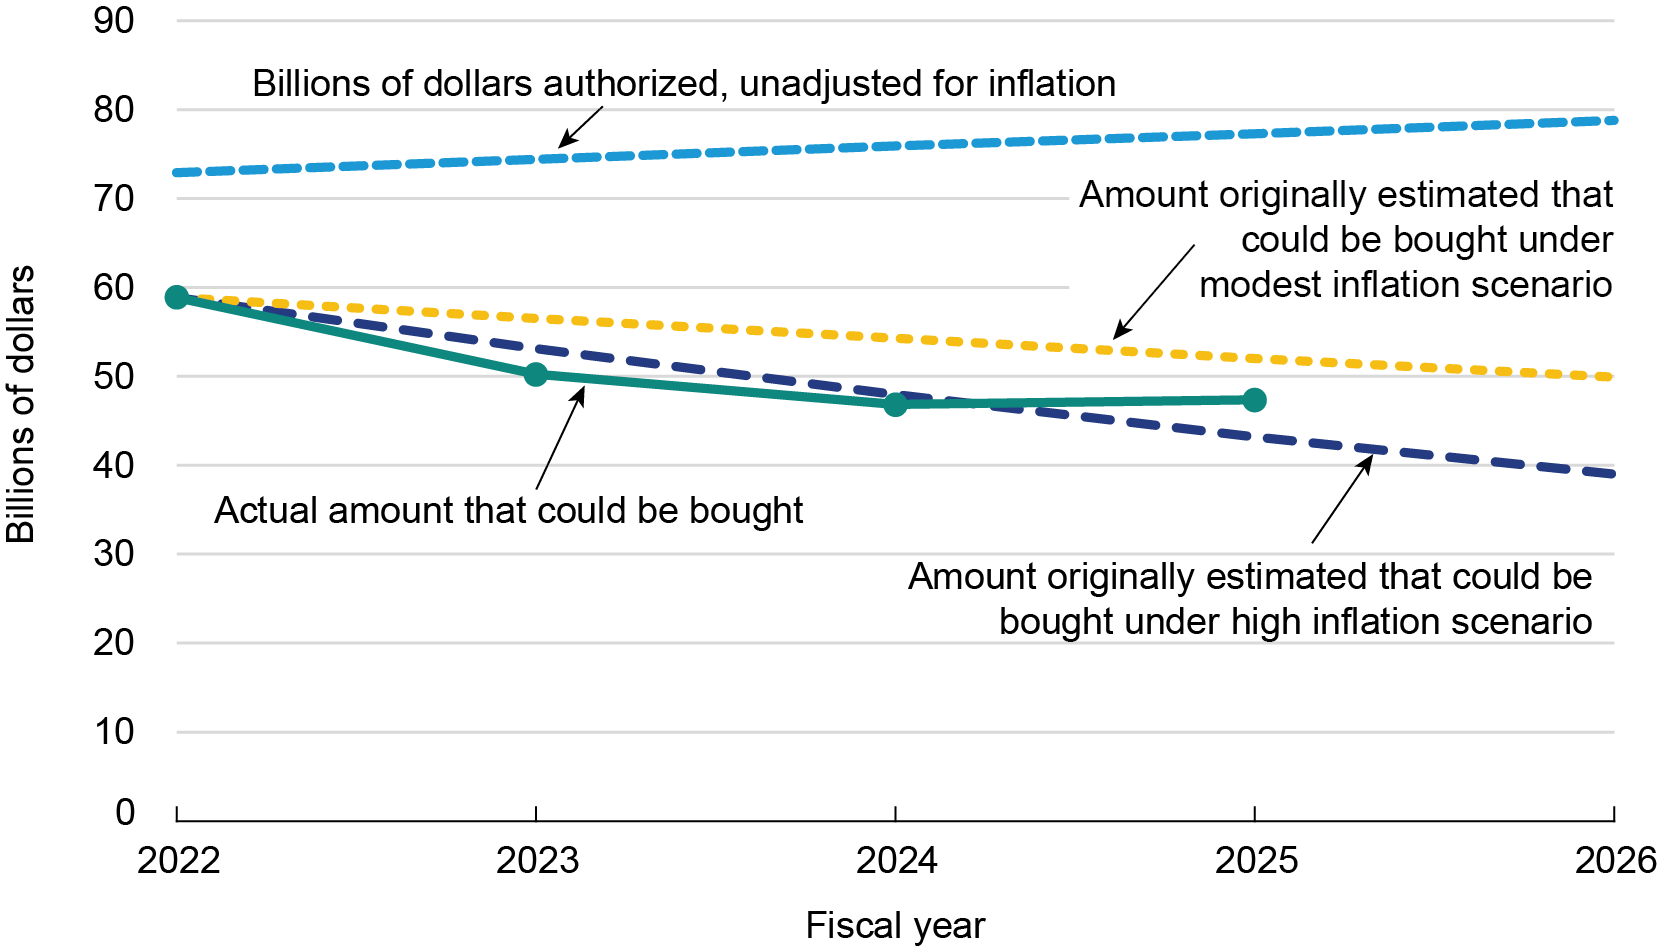
Looking at the years for which construction cost data now are available, FY 2023 through 2025, construction cost inflation reduced IIJA recipient’s buying power for highway construction by an amount between the High and Modest Inflation Scenarios. In FY 2023, highway construction costs grew, year-over-year, 6.6 percentage points more than assumed under the High Inflation Scenario and 13.3 percentage points more than assumed under the Moderate Inflation Scenario.4 Highway construction costs fell in the third quarter of FY 2024 before rising again in the fourth quarter of FY 2024, albeit at a slower rate than in FY 2023 (Figure 2). As a result, the change in highway construction costs from FY 2023 to 2024 was less than assumed under the original High Inflation Scenario (-3.6 percentage points) but more (3.2 percentage points) than assumed under the Modest Inflation Scenario. Although highway construction costs rose less in FY 2024, buying power remained below the amount predicted under both scenarios because of above modest growth in highway construction costs in FY 2023, which boosted highway construction costs in FY 2024 above the level predicted in both years. As a result, less could be bought in FY 2024 than predicted in the Modest Inflation Scenario ($46.8 billion versus the predicted $54.3 billion in 2021 USD) and less than predicted in the High Inflation Scenario ($46.8 billion versus the predicted $48.0 billion in 2021 USD) (Figure 6). In contrast, highway construction costs grew significantly less (0.6 percent) from FY 2024 to 2025 than predicted under both the Modest and High Inflation Scenario (16.3 and 13.0 percent, respectively), and the difference was large enough that more could be bought under the High Inflation Scenario in FY 2025 than predicted ($47.4 billion versus the predicted $43.2 billion in 2021 USD) despite higher than expected growth in highway construction costs in FY 2023. However, still less could be bought in FY 2025 under the Modest Inflation Scenario than predicted ($47.4 billion versus $52.0 billion in 2021 USD, respectively). In total, increases in highway construction costs reduced what could have been bought from FY 2023 to 2025 by 37 percent; $0.1 billion more than initially predicted under the High Inflation Scenario but $18.4 billion less than predicted under the Modest Inflation Scenario (in 2021 USD).
Figure 6. IIJA Funds Authorized for Highway by Fiscal Year and Amount Reduced by Construction Cost
Inflation
Note: The High Inflation Scenario equals the amount that could be bought with authorized IIJA funding for highways assuming construction costs continue to grow at the average of the 2021 and 2022 annual growth. The Modest Inflation Scenario equals the amount that could be bought with authorized IIJA funding for highways assuming construction costs continue to grow at the average of the 2019 and 2021 annual growth.
Source: BTS, data from FHWA n.d. and BTS n.d.
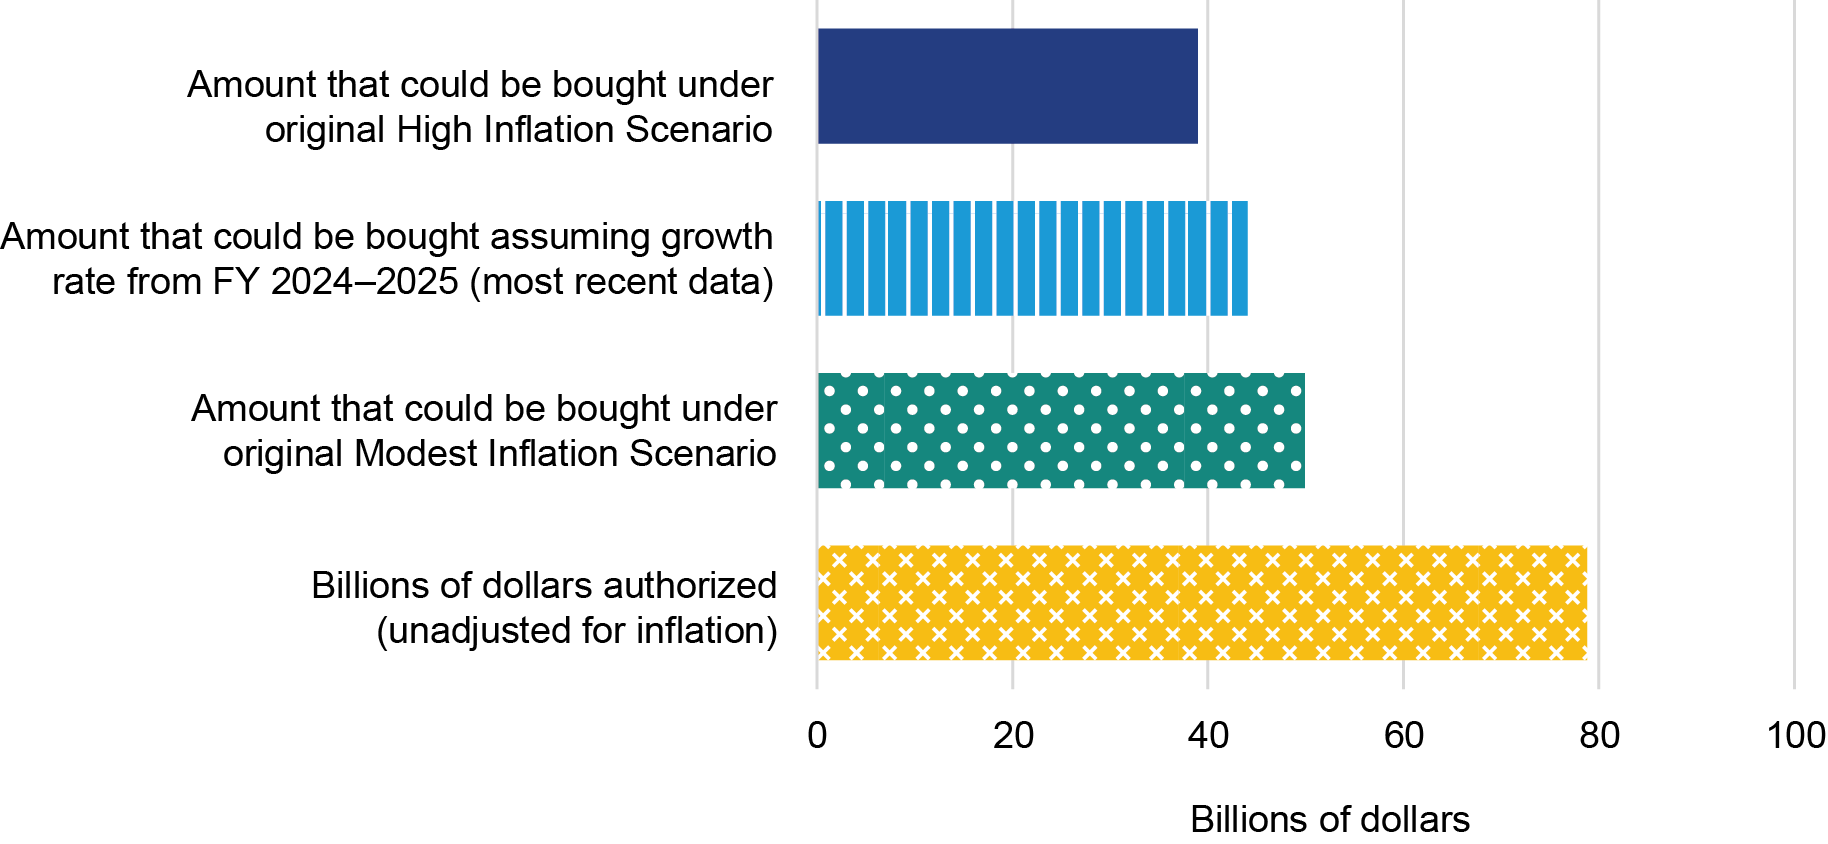
Construction cost data are not available beyond the last quarter of FY 2025. Because construction costs slowed in FY 2025, IIJA may cover more highway construction projects in FY 2026 than initially predicted in the High Inflation Scenario. If highway construction costs increase in FY 2026 by the growth rate from FY 2024 to 2025 (latest full year of data), $9.0 billion (in 2021 USD) more can be bought in FY 2026 than predicted in the High Inflation Scenario but still significantly less than when the president signed IIJA (Figure 7). In contrast, less can be bought compared to the Modest Inflation Scenario. Highway construction costs increased at more than the initially predicted moderate rate in FY 2023 and, as a result, boosted highway construction costs in the years after FY 2023 by more than the initially predicted moderate level. As a result, $5.9 billion (in 2021 USD) less than initially predicted in the Modest Inflation Scenario can be bought in FY 2026, if highway construction costs increase at the same rate as from FY 2024 to 2025.
Figure 7. IIJA Funds Authorized for Highway by Fiscal Year, Original, and Updated Prediction of
Amount Reduced by Construction Cost Inflation, FY 2026
Note: The High Inflation Scenario equals the amount that could be bought with authorized IIJA funding for highways assuming construction costs continue to grow at the average of the 2021 and 2022 annual growth. The Modest Inflation Scenario equals the amount that could be bought with authorized IIJA funding for highways assuming construction costs continue to grow at the average of the 2019 and 2021 annual growth.
Source: BTS, data from FHWA n.d. and BTS n.d.
DATA SOURCES AND FURTHER INFORMATION
Construction costs are from the Federal Highways Administration’s NHCCI as featured in U.S. Department of Transportation, BTS, Transportation Economic Trends, Value of Transportation Infrastructure and Other Assets: National Highway Construction Cost Index. The NHCCI measures the change in the prices paid by state transportation departments for roadway construction materials and services over time. The NHCCI includes sales and excise taxes, distribution costs, contractor’s mark-up, and other fees paid by state transportation departments for highway construction. The NHCCI is different from the PPI in that the NHCCI measures from the perspective of the buyer (by including taxes, mark-up, and other fees) whereas the PPI measures from the perspective of the seller (and hence does not include taxes, mark-up, and other fees).
Funds authorized for transportation infrastructure in IIJA are from the BTS’ Transportation Economic Trends page on Transportation Funding in the Infrastructure Investment and Jobs Act.
REFERENCES
BLS. n.d. Producer Price Indexes, All Commodities and Asphalt (not seasonally adjusted). Washington, DC: U.S. Bureau of Labor Statistics. https://www.bls.gov/ppi/. Last accessed April 2026.
BTS. 2024. “Increases in Highway Construction Costs Could Reduce IIJA Funding Allocated to Transportation Up to 40% Over the Next Five Years.” Washington, DC: U.S. Department of Transportation. https://www.bts.gov/data-spotlight/increases-highway-construction-costs-could-reduce-iija-funding-allocated. Last accessed April 2026.
———n.d. Transportation Funding in the IIJA. Washington, DC: U.S. Department of Transportation. https://data.bts.gov/stories/s/cvki-zubk. Last accessed April 2026
EIA. n.d. Cushing OK WTI Spot Price FOB. Washington, DC: U.S. Energy Information Administration. https://www.eia.gov/dnav/pet/hist/LeafHandler.ashx?n=PET&s=RWTC&f=M. Last accessed April 2026.
FHWA. n.d. National Highway Construction Cost Index. Washington, DC: U.S. Department of Transportation. https://data.transportation.gov/Research-and-Statistics/NHCCI/r94d-n4f9/about_data. Last accessed April 2026
Tauber, Kristin and Willem Van Zandweghe. 2021. “Why Has Durable Goods Spending Been So Strong during the COVID-19 Pandemic?,” Economic Commentary. Cleveland, OH: Federal Reserve Bank of Cleveland. https://www.clevelandfed.org/publications/economic-commentary/2021/ec-202116-durable-goods-spending-during-covid19-pandemic. Last accessed November 2025.
CITATION
United States Department of Transportation, Bureau of Transportation Statistics. Increases in Highway Construction Costs Reduced the Economic Value of Transportation’s IIJA Funding by 32 Percent From FY 2022 to 2025: An Analysis of Potential Reductions in 2026. Washington, DC: 2026. https://doi.org/10.21949/wmmg-ge17.
QUALITY ASSURANCE STATEMENT
The Bureau of Transportation Statistics (BTS) provides high quality information to serve government, industry, and the public in a manner that promotes public understanding. Standards and policies are used to ensure and maximize the quality, objectivity, utility, and integrity of its information. BTS reviews quality issues on a regular basis and adjusts its programs and processes to ensure continuous quality improvement.
NOTICE
This document is disseminated under the sponsorship of the U.S. Department of Transportation in the interest of information exchange. The U.S. Government assumes no liability for its contents or use thereof.
MORE BTS PUBLICATIONS
To access more publications and statistical products from BTS, visit www.bts.gov/browse-statistical-products-and-data.
FOOTNOTES
- ^ The highest price on record, reached in June 2008, is $133.88 per barrel [EIA n.d.]. Records begin in January 1986.
- ^ Because construction cost growth in 2022 could be seen as an outlier, the previous brief used the average of the annual growth rate from 2021 and 2022. Using 2 more closely approximates the most recent trend in the data rather than a single aberration.
- ^ 2020 data are excluded due to COVID-19 being declared a national emergency on March 13, 2020, subsequent effects from stay-at-home orders and business closures in many states, and supply chain issues caused by the restrictions.
- ^ 2022 projections are not discussed because 2022 construction costs were available at the time of the first iteration of this brief. In 2022, highway construction cost inflation reduced the amount of highway construction funded by IIJA by 21 percent.