
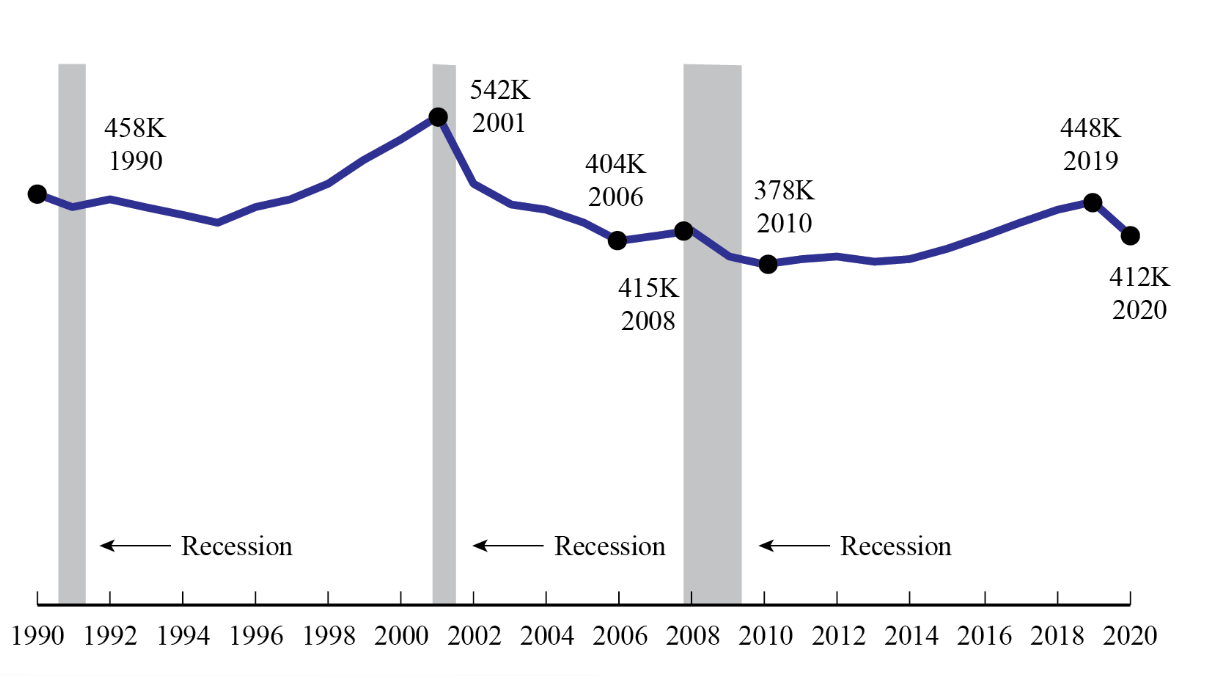
Figure 1: Employees at U.S. Scheduled Passenger Airlines Month of May, 1990-2020
(Full-Time Equivalents)
Figure
Dataset Table:
| May FTEs in thousands (000) | 1 | |
|---|---|---|
| 1990 | 457.8 | 2 |
| 1991 | 443.6 | 3 |
| 1992 | 450.2 | 4 |
| 1993 | 443.3 | 5 |
| 1994 | 433.2 | 6 |
| 1995 | 425.3 | 7 |
| 1996 | 441.7 | 8 |
| 1997 | 449.9 | 9 |
| 1998 | 468.7 | 10 |
| 1999 | 493.8 | 11 |
| 2000 | 517.5 | 12 |
| 2001 | 542.1 | 13 |
| 2002 | 468.5 | 14 |
| 2003 | 444.4 | 15 |
| 2004 | 438.8 | 16 |
| 2005 | 423.7 | 17 |
| 2006 | 403.7 | 18 |
| 2007 | 411.9 | 19 |
| 2008 | 415.5 | 20 |
| 2009 | 387.4 | 21 |
| 2010 | 377.5 | 22 |
| 2011 | 385.3 | 23 |
| 2012 | 388.5 | 24 |
| 2013 | 381.4 | 25 |
| 2014 | 385.6 | 26 |
| 2015 | 395.6 | 27 |
| 2016 | 410.3 | 28 |
| 2017 | 425.7 | 29 |
| 2018 | 438.2 | 30 |
| 2019 | 448.0 | 31 |
| 2020 | 411.7 | 32 |
| 33 |
Notes:
FTE calculations count two part-time employees as one full-time employee.
Source:
Bureau of Transportation Statistics