
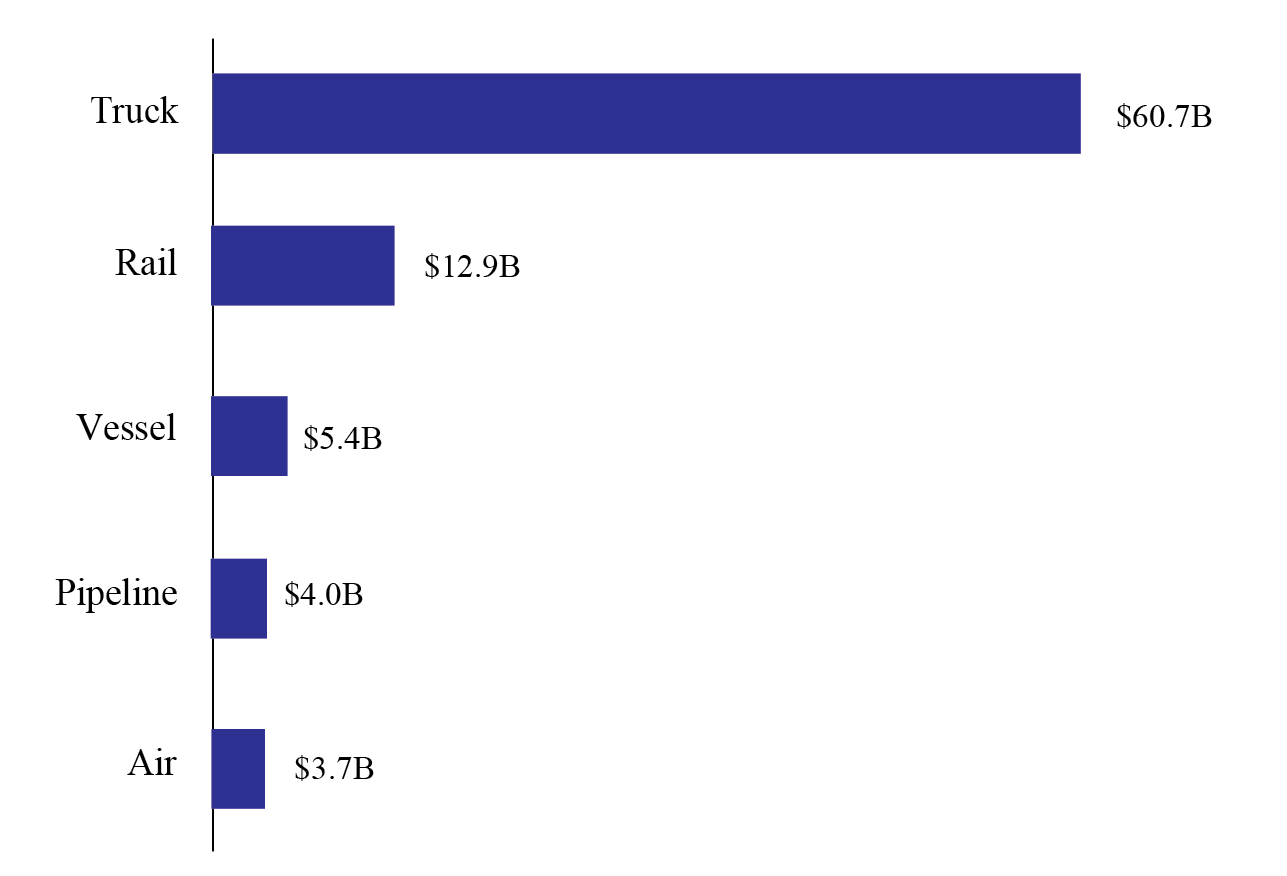
Figure 1: North American Freight by Mode, July 2020
(Dollars in Billions)
Figure
Dataset Table:
| Mode | Value | 1 |
|---|---|---|
| Truck | 60.7 | 2 |
| Rail | 12.9 | 3 |
| Vessel | 5.4 | 4 |
| Pipeline | 4.0 | 5 |
| Air | 3.7 | 6 |
| 7 |
Source:
Bureau of Transportation Statistics, TransBorder Freight Data, https://www.bts.gov/transborder