
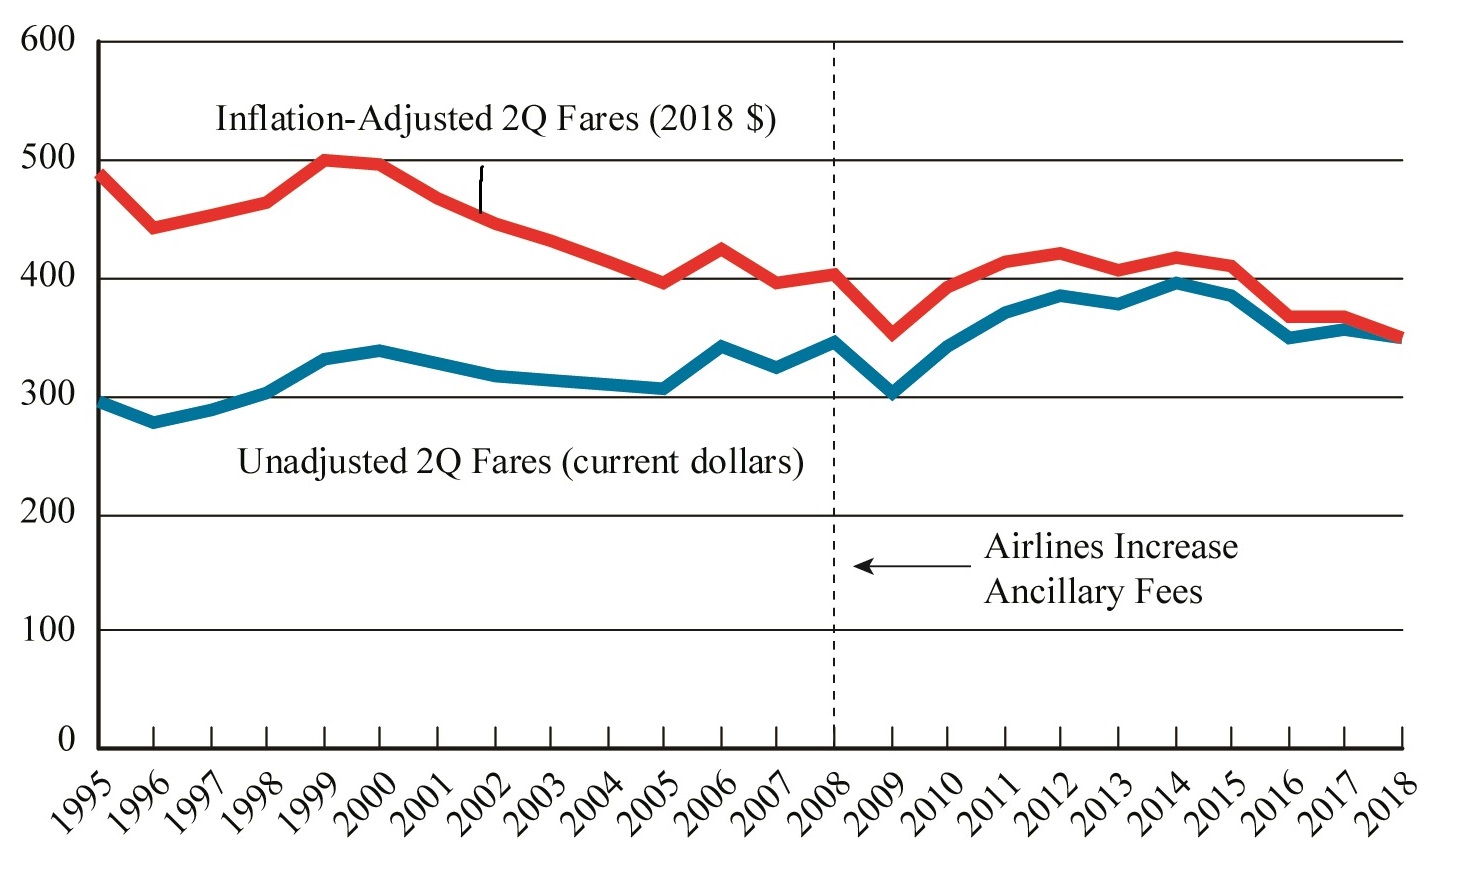
Figure 1. U.S. Average Domestic Fares, 2nd Quarter 1995-2018
Figure
Dataset Table:
| Unadjusted 2Q Fares (current dollars) | Inflation-Adjusted 2Q Fares (2018 $) | 1 | |||
|---|---|---|---|---|---|
| 1995 | 297 | 490 | 2 | ||
| 1996 | 276 | 443 | 3 | ||
| 1997 | 289 | 454 | 4 | ||
| 1998 | 301 | 465 | 5 |
Source:
Bureau of Transportation Statistics, Origin and Destination Survey