
Transportation Geography of the United States 2026
Figure
Description:
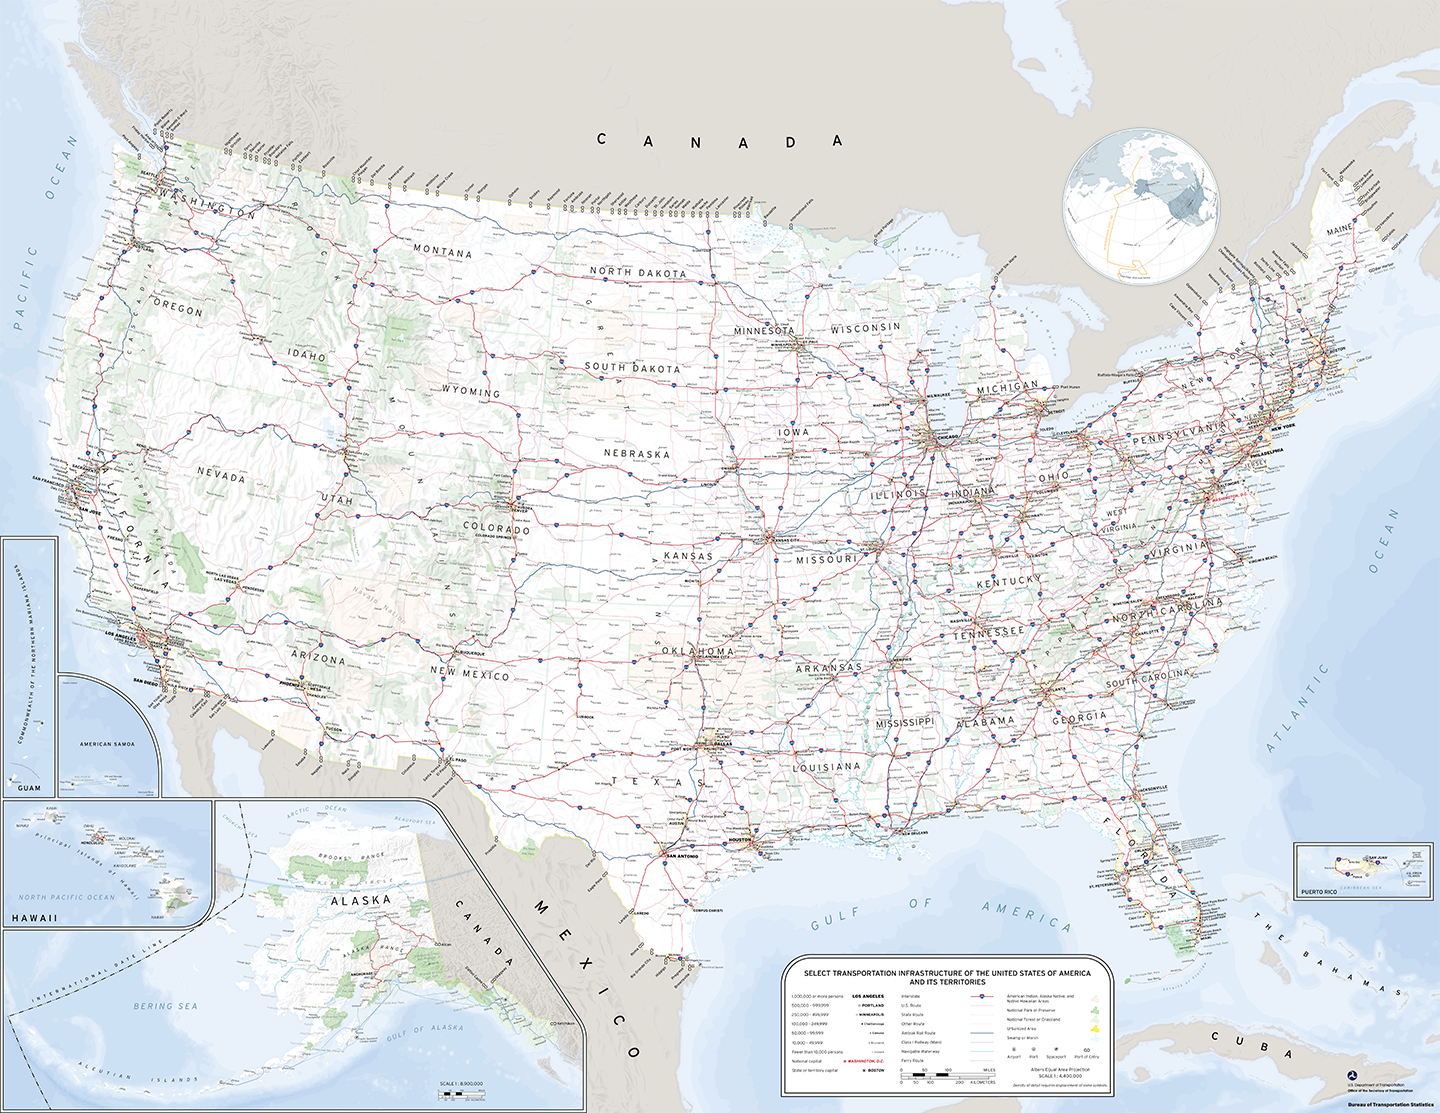
Select Transportation Infrastructure of the United States and its Territories
Front:
Description
The front side of our 2-sided print map, Transportation Geography of the U.S. 2026, showing:
- Major airports;
- Major marine ports;
- Navigable waterways;
- Person border crossings;
- Interstate highways;
- US, State, and County highways;
- Amtrak routes; and
- Class I rail lines.
NOTE: Major airports include only airports with 1 million enplanements or more in 2024. Principal ports are defined by the United States Army Corp of Engineers based on upon ports’ total tonnage in 2023. Ports of entry refer to any place designated by U.S. law at which Customs and Border Protection is authorized to accept entries of people, vehicles, or merchandise to collect duties, and to enforce the various provisions of the customs and navigation laws. Several border crossings can be associated with a given port of entry. The density of detail requires displacement of some symbols for legibility. This map should not be used for surveying or navigational purposes.
SOURCE: U.S. Department of Transportation, Bureau of Transportation Statistics, National Transportation Atlas Database, 2025; United States Geological Survey Domestic Names and Geographic Information System (GNIS).
Back
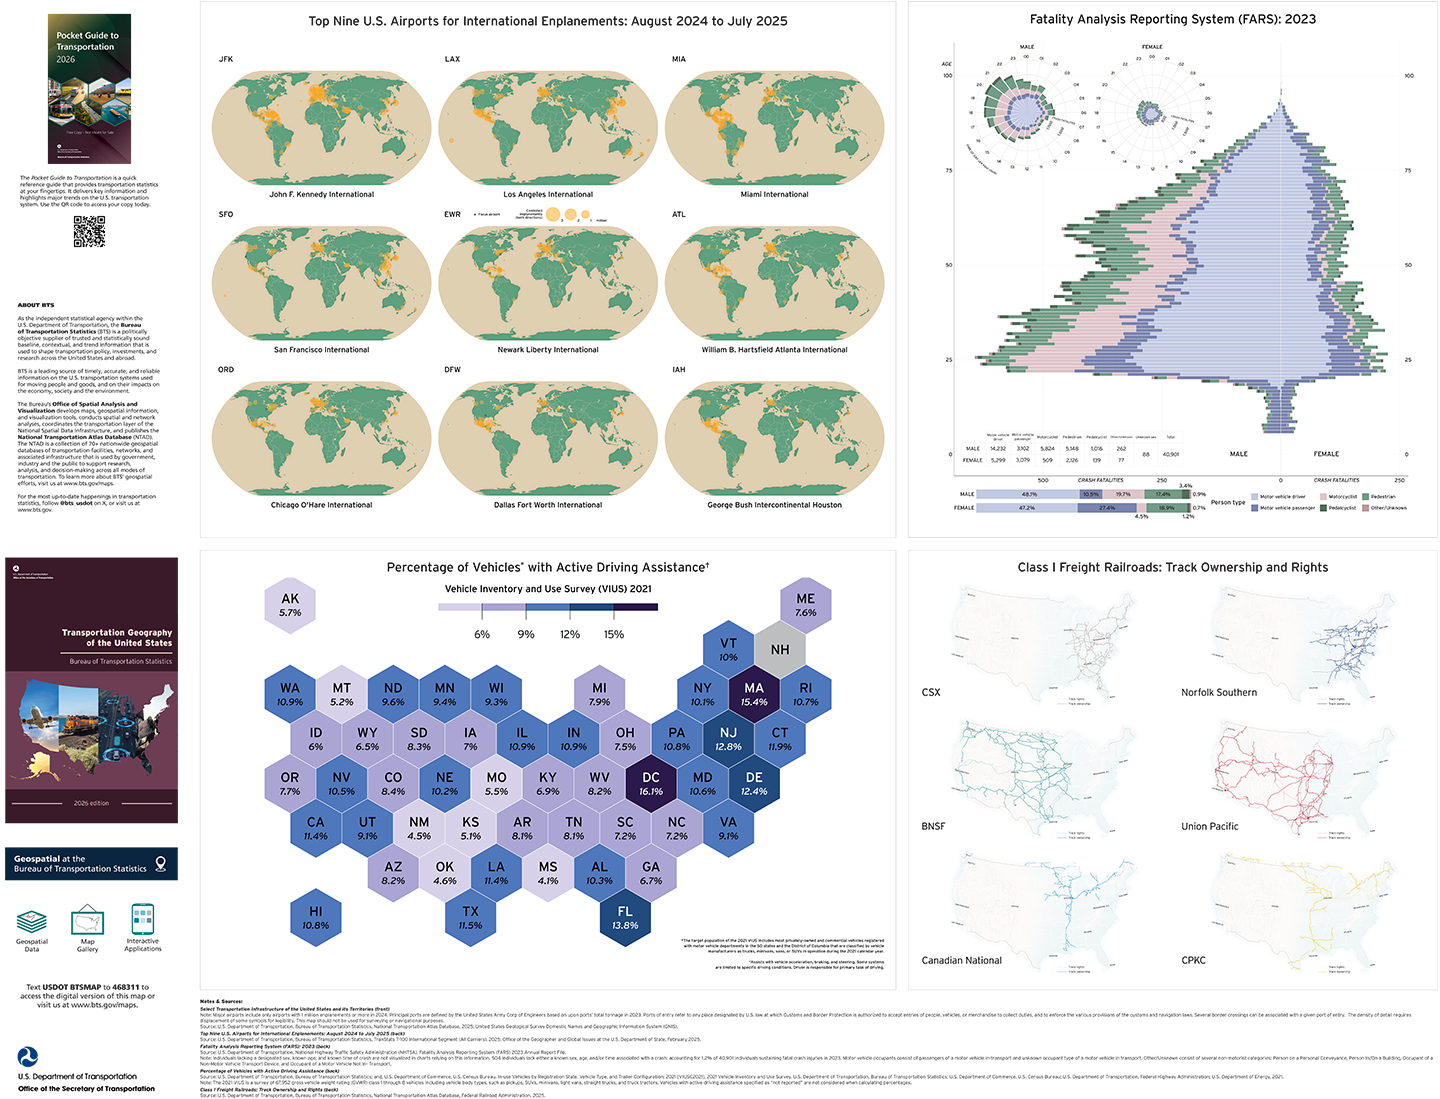
Top Nine U.S. Airports for International Enplanements: August 2024 to July 2025
SOURCE: U.S. Department of Transportation, Bureau of Transportation Statistics, TranStats T-100 International Segment (All Carriers), 2025; Office of the Geographer and Global Issues at the U.S. Department of State, February 2025.
Percentage of Vehicles with Active Driving Assistance
NOTE: The 2021 VIUS is a survey of 67,952 gross vehicle weight rating (GVWR) class 1 through 8 vehicles including vehicle body types, such as pickups, SUVs, minivans, light vans, straight trucks, and truck tractors. Vehicles with active driving assistance specified as "not reported" are not considered when calculating percentages.
SOURCE: U.S. Department of Transportation, Bureau of Transportation Statistics; and, U.S. Department of Commerce, U.S. Census Bureau. In-use Vehicles by Registration State, Vehicle Type, and Trailer Configuration: 2021 [VIUSC2021]. 2021 Vehicle Inventory and Use Survey. U.S. Department of Transportation, Bureau of Transportation Statistics; U.S. Department of Commerce, U.S. Census Bureau; U.S. Department of Transportation, Federal Highway Administration; U.S. Department of Energy, 2021.
Class I Freight Railroads: Track Ownership and Rights
SOURCE: U.S. Department of Transportation, Bureau of Transportation Statistics, National Transportation Atlas Database, Federal Railroad Administration, 2025.
Fatality Analysis Reporting System (FARS): 2023
NOTE: Individuals lacking a designated sex, known age, and known time of crash are not visualized in charts relying on this information. 504 Individuals lack either a known sex, age, and/or time associated with a crash: accounting for 1.2% of 40,901 individuals sustaining fatal crash injuries in 2023. Motor vehicle occupants consist of passengers of a motor vehicle in-transport and unknown occupant type of a motor vehicle in transport. Other/Unknown consist of several non-motorist categories: Person on a Personal Conveyance, Person In/On a Building, Occupant of a Non-Motor Vehicle Transport Device, and Occupant of a Motor Vehicle Not In- Transport.
SOURCE: U.S. Department of Transportation, National Highway Traffic Safety Administration (NHTSA), Fatality Analysis Reporting System (FARS) 2023 Annual Report File.