


Truck movements in Texas during the January 23–27, 2026 winter storm
Figure
Description:
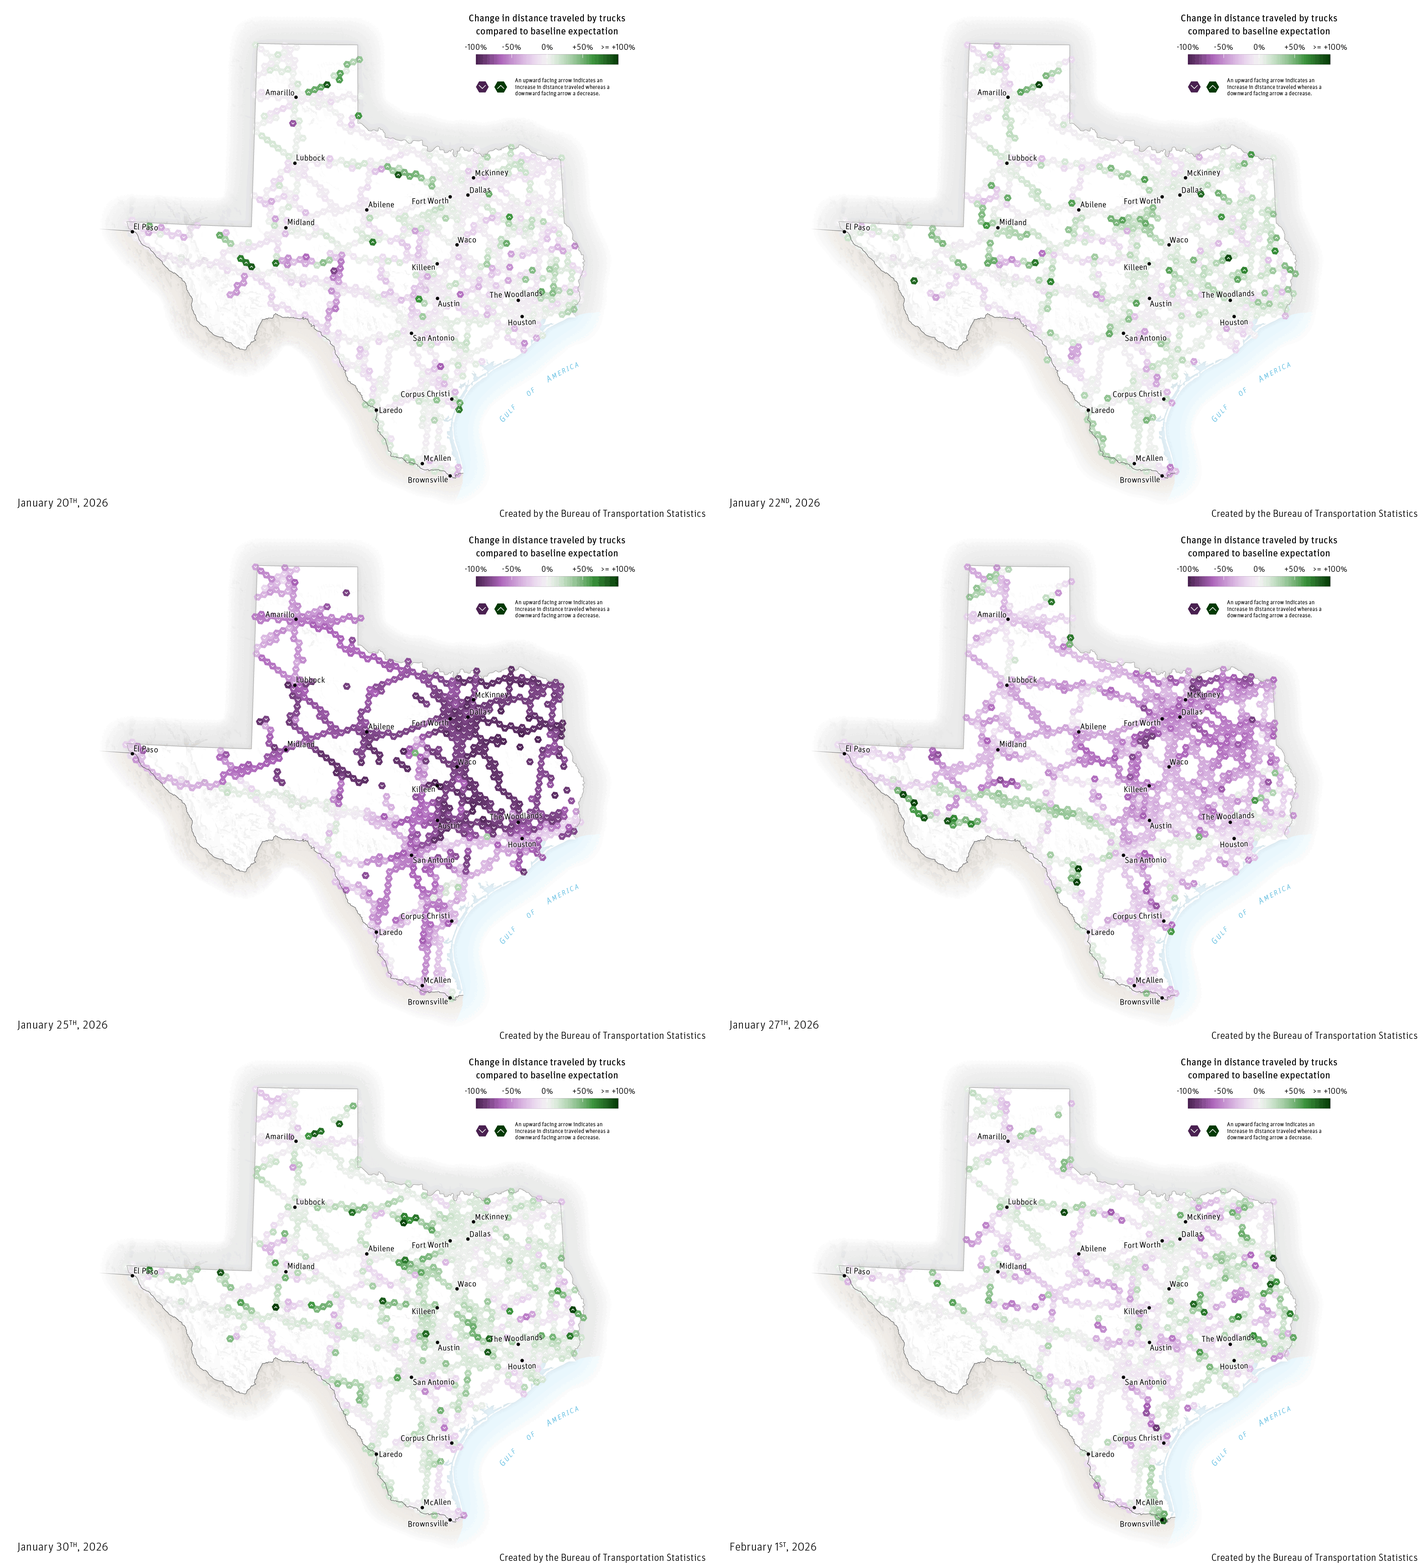
The maps comprising this animation depict truck movement trends in Texas detected during the January 23–27, 2026 winter storm and are derived from the Bureau of Transportation Statistics’ Freight Mobility Initiative (FMI), a national database of freight truck GPS pings. FMI data from January 20th to February 1st was aggregated to a hexagonal grid enabling comparisons of distance traveled by trucks in each grid cell over time at a daily cadence compared against an expected baseline. Cells in shades of purple indicate a lower expected travel distance by trucks whereas shades of green depict areas with a higher than expected distance traveled. As precipitation began to accumulate on the 23rd, there was a sharp reduction in truck distance traveled along major routes, especially pronounced in the Texas Triangle. As roadway conditions improved, there was an increase in the expected distance traveled by trucks. This methodology and visualization can be used to detect high level trends in truck movements by identifying bottleneck areas and provide information for targeted intervention for the improvement of truck freight conveyance.
Source:
U.S. Department of Transportation, Bureau of Transportation Statistics, Freight Mobility Initiative (FMI), 2026.