


Transportation Public Finance Statistics (TPFS)
Transportation Public Finance Statistics (TPFS) provides information on transportation-related revenue and expenditures for all levels of government, including federal, state and local, and for all modes of transportation.
Government transportation revenues come from several sources, including user fees, transportation related taxes, and general revenues. This revenue funds government transportation expenditures on critical activities, like building highways, operating the Nation’s air traffic control system, and maintaining transit facilities. User fees from transportation totaled over $240 billion across all levels of government and all modes in 2024.
State-Level data for 2024 is now available. The Bureau of Transportation Statistics (BTS) has released the most recent transportation-related revenue and expenditure data for state and local levels. Aggregate values for 2024 were released in May 2026.
Due to changes in the availability of key source data, BTS released the final aggregated 2024 numbers in 2026. BTS released the 2024 State Level data in September of 2026. Future releases will depend on availability of data. BTS hopes to release the TPFS on an earlier schedule.
TPFS also expands on the categories of revenues and expenditures:
- Revenue separated by:
- Own-Source: includes user-based revenue and other revenue received directly or directly generated by transportation agencies (e.g., dedicated taxes levied by transportation agencies, other operating revenue received directly by transportation agencies). Own-source revenue can also have a sub classification of user-based.
- User-Based: includes only revenue generated from charges on users of the mode related to their transportation activity (e.g., fuel taxes, motor vehicle taxes and fees, and tolls for highways, transit fares, etc.).
- Other: revenue that is not user-based
- Supporting: funds collected from non-transportation-related activities but dedicated to support transportation programs, e.g., receipts received by state and local governments from sales or property taxes. It excludes funds raised from transportation-related activities but used to finance programs other than transportation.
- Own-Source: includes user-based revenue and other revenue received directly or directly generated by transportation agencies (e.g., dedicated taxes levied by transportation agencies, other operating revenue received directly by transportation agencies). Own-source revenue can also have a sub classification of user-based.
- Expenditures separated by:
- Capital: outlays for new equipment and structures and for improving or enhancing the capacity and quality of the existing equipment and structures. TPFS defines capital expenditures by the useful life; TPFS classifies expenditures as capital improvements that last more than one year.
- Non-Capital: includes operation and maintenance costs, as well as research, administration, and other costs government agencies incur in managing transportation systems that are not classified as capital investments.
- Federal cash flows that pass through transportation trust funds separately from general funds.
Historically, BTS released preliminary estimates in June and final estimates in December. Due to earlier availability of source data, BTS released the final estimates for 2024 in May of 2026. BTS expects to release the 2024 State-level data in July of 2026. Future releases will depend on data availability. BTS hopes to continue TPFS releases on an earlier schedule and will prioritize timely releases once data is available. The Federal Highway Administration did not release the local highway revenue and expenditure data for 2023, thus BTS omitted highways in the 2023 state-level data. Aggregate state data does include highways for 2023, and BTS continues to use estimates for the local line items with missing data.
The TPFS User Guide details the classifications and sources for data.
Sankey Diagrams
As seen in the chart below, most highway expenditure occurs at the state and local level - and while the majority of the funding ($262.9 billion) comes from state and local governments, $65.1 comes from transfers from the Federal Government, including but not limited to transfers from the highway trust fund. Of the state and local government funding, $130.9 billion is user-based revenue but the majority ($132.1 billion) is from other taxes and general funds. Federal revenue is mostly highway user taxes ($46.9 billion) but some ($12.4 billion) is from general and other funds.
2024 U.S. Highway Funding: A Visual Flow of Public Revenue and Outlays (billions)
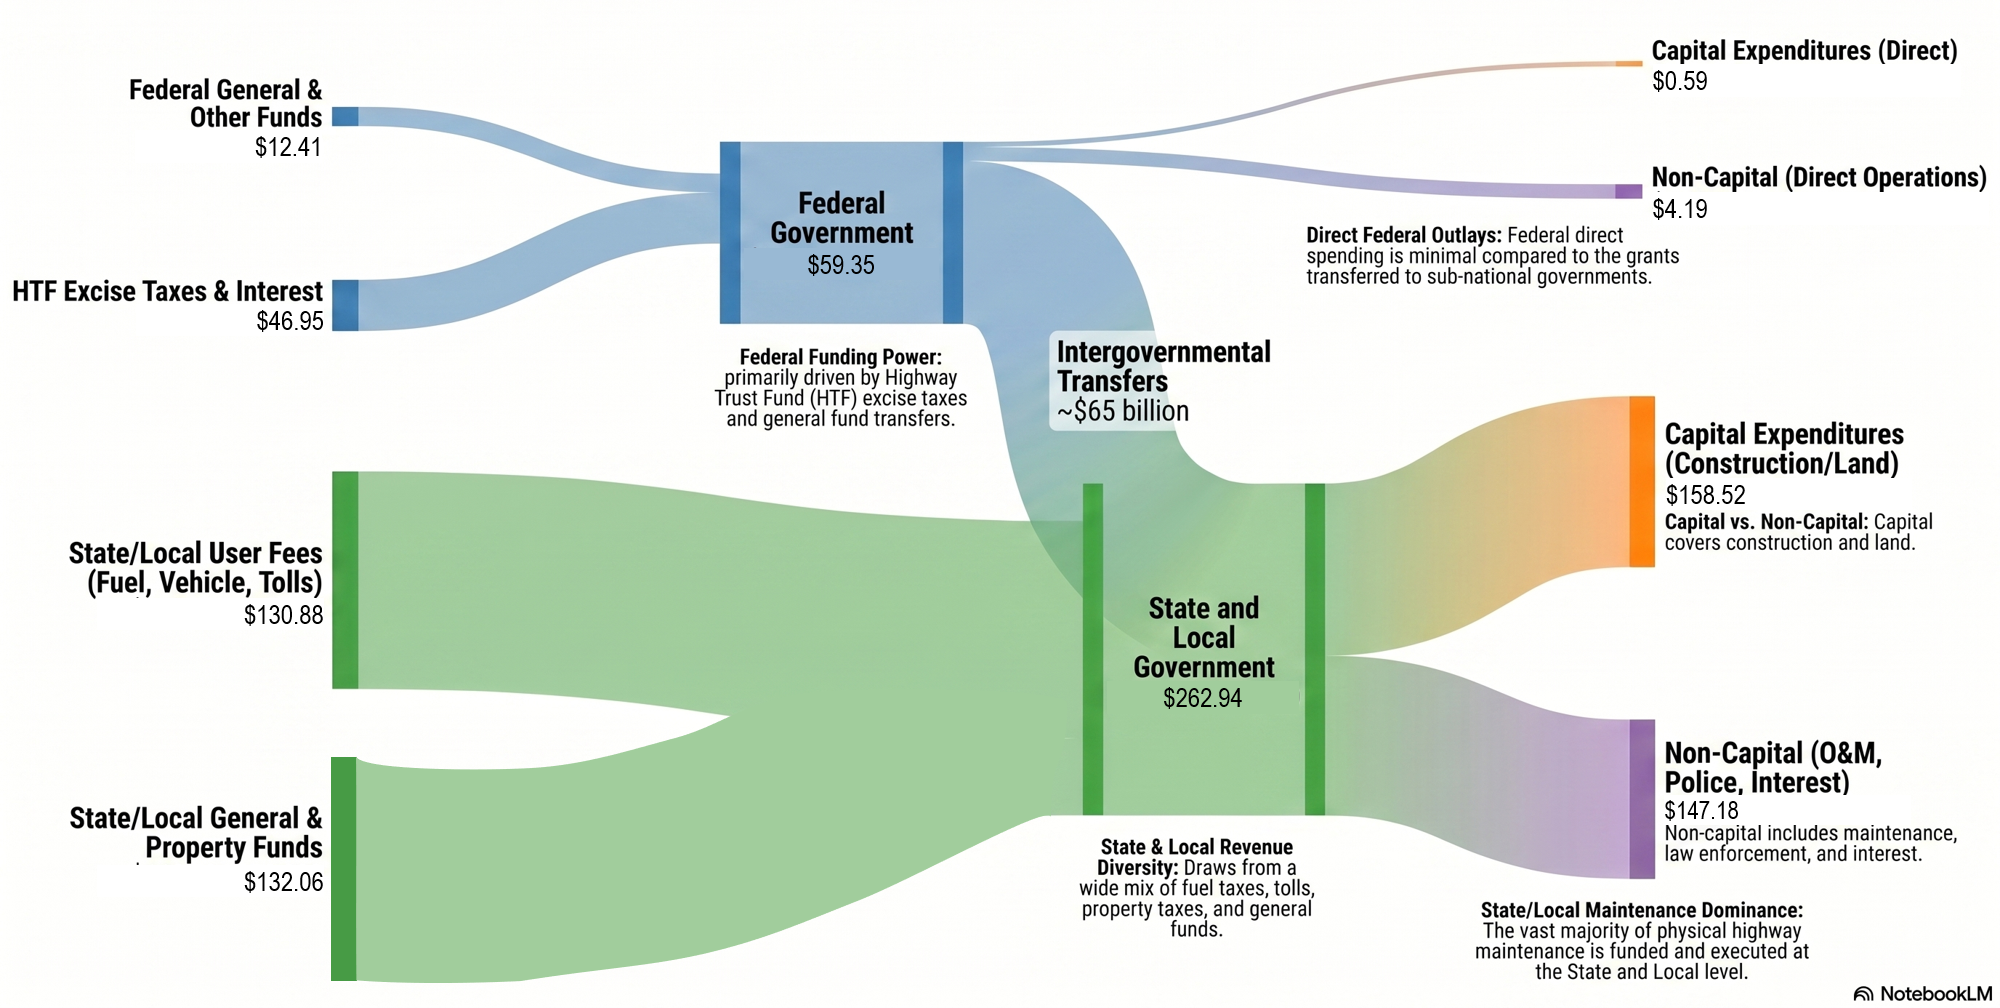
Note: This diagram was generated by NotebookLM. The sum of federal expenditures and transfers to state and local governments exceeds total federal revenues by $10.5 because some funding represents drawdowns of the existing Highway Trust Fund balance. State and local total revenues (plus federal transfers) exceed state and local expenditures by $22.3 billion because some funds went to pay down debts.
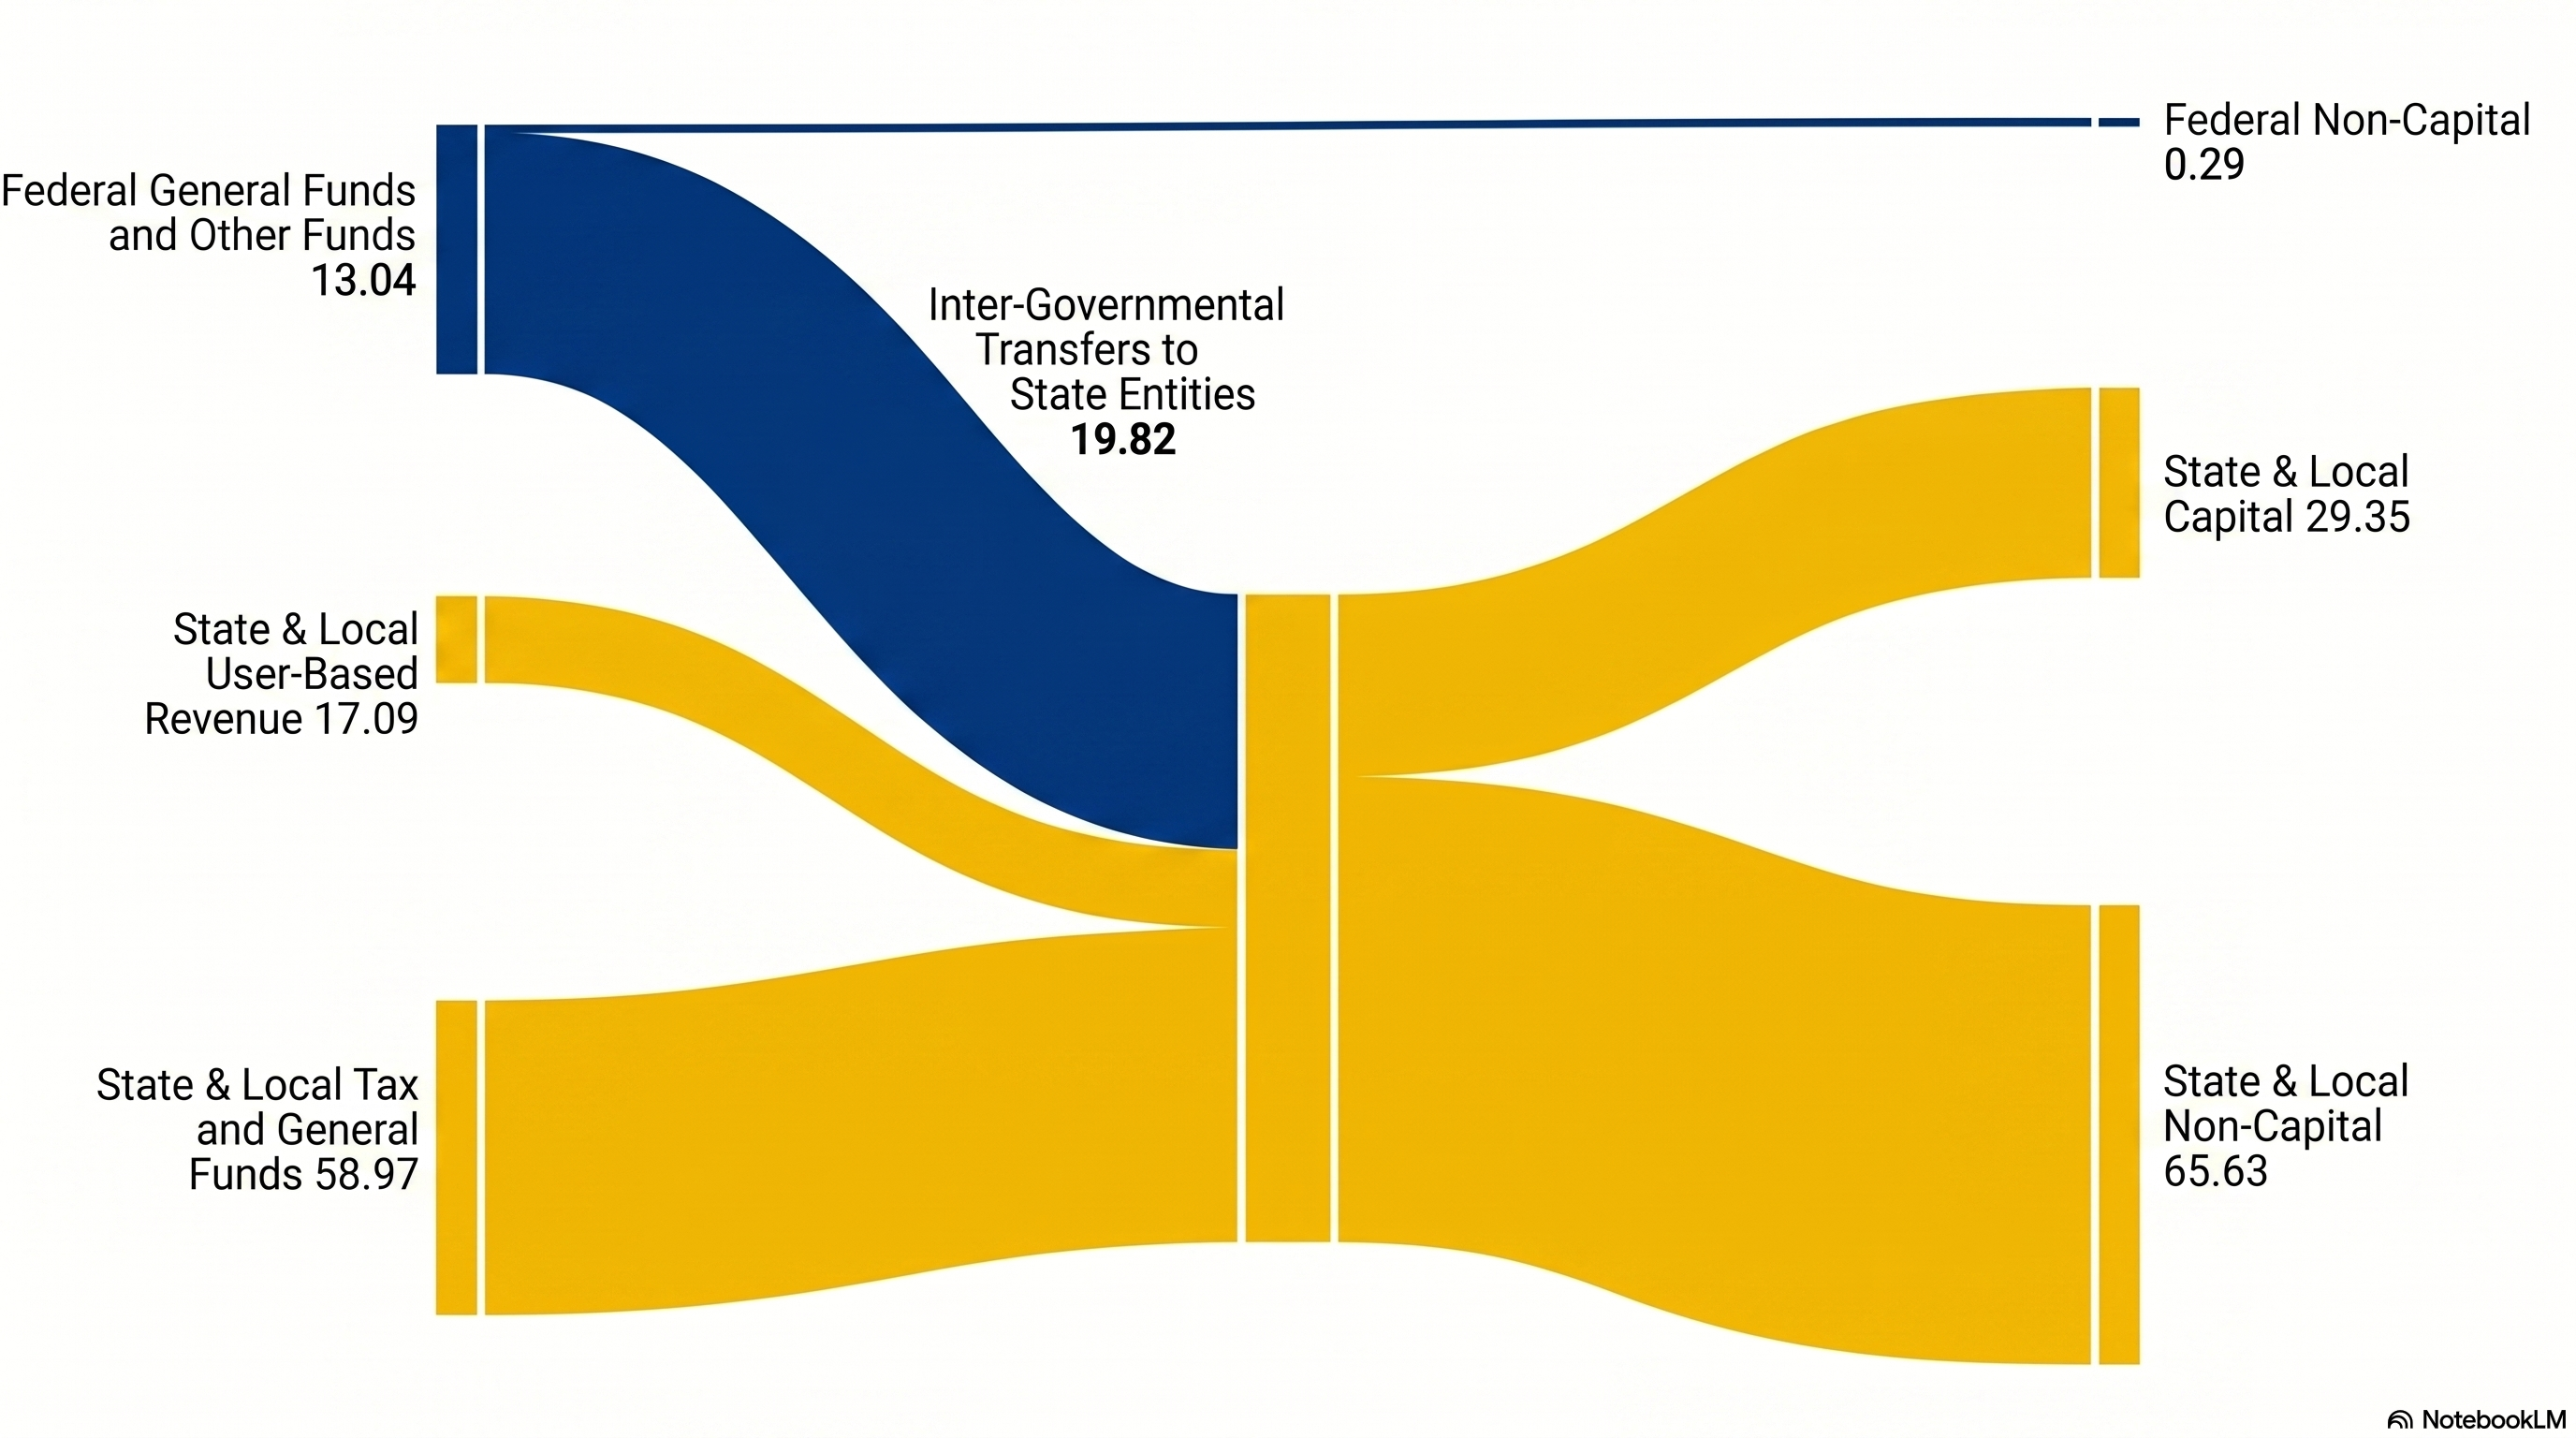
As seen in the chart below, almost all transit expenditure occurs at the state and local level while the majority of the funding ($76.1 billion) comes from state and local governments, $19.8 comes from transfers from the Federal Government.
2024 U.S. Transit Funding: A Visual Flow of Public Revenue and Outlays (billions)
A core part of the BTS mission is to provide the transportation financial statistics needed to inform the policy and management decision-making of a variety of transportation actors, including policymakers at all levels of government.
The government plays an important role in the U.S. transportation system, as a provider of transportation infrastructure and as an administrator and regulator of the system. The government spends a large amount of funds on building, rehabilitating, maintaining, operating, and administering the transportation system. Government revenue generated from several sources including user fees, taxes from transportation and non-transportation-related activities, and grants from federal, state, and local governments primarily supports these activities.
The Infrastructure Investment and Jobs Act (IIJA) provided approximately $673.8 billion for transportation over 5 years. IIJA's impact on transportation expenditures will be captured in 2022-2026 releases. For more details on those funds, visit Statistics on Transportation Funding in IIJA.
The Coronavirus Aid, Relief and Economic Security (CARES) Act, the Consolidated Appropriations Act 2021 (CRRSA Act), and the American Rescue Plan (ARP) Act – impacted transportation expenditures. The CARES Act funded $114.8 billion in transportation expenditures in 2020 and the CRRSA Act funded $45.0 billion in transportation expenditures and the ARP funded $58.4 billion for in transportation expenditures in 2021. For more information on those funds, visit COVID-19 Stimulus Funding for Transportation.