
July 2018 U.S. Passenger Airline Employment Data
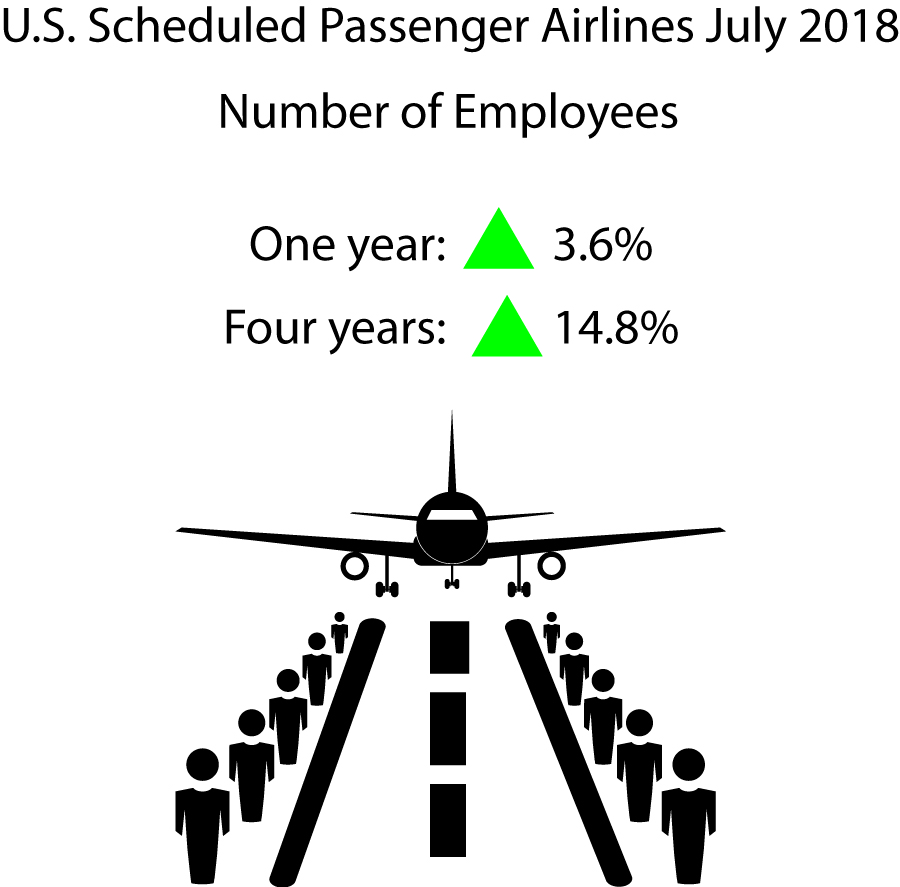
U.S. scheduled passenger airlines employed 3.6 percent more workers in July 2018 than in July 2017:
- July’s 443,475 full-time equivalents (FTE) was the highest monthly employment total since July 2004 (444,431 FTEs).
- June was the 57th consecutive month that U.S. scheduled passenger airline FTEs exceeded the same month of the previous year.
Scheduled Passenger Airline Full-Time Equivalent Employees, Month of July, 1990-2018
| July FTEs in thousands (000) | 1 | |
|---|---|---|
| 1990 | 465.8 | 2 |
| 1991 | 450.7 | 3 |
| 1992 | 453.4 | 4 |
| 1993 | 446.4 | 5 |
| 1994 | 439.2 | 6 |
| 1995 | 431.0 | 7 |
| 1996 | 437.2 | 8 |
| 1997 | 455.5 | 9 |
| 1998 | 474.6 | 10 |
| 1999 | 501.7 | 11 |
| 2000 | 524.8 | 12 |
| 2001 | 537.2 | 13 |
| 2002 | 473.4 | 14 |
| 2003 | 434.4 | 15 |
| 2004 | 444.4 | 16 |
| 2005 | 428.1 | 17 |
| 2006 | 403.0 | 18 |
| 2007 | 414.3 | 19 |
| 2008 | 411.1 | 20 |
| 2009 | 386.8 | 21 |
| 2010 | 378.1 | 22 |
| 2011 | 387.5 | 23 |
| 2012 | 388.6 | 24 |
| 2013 | 381.3 | 25 |
| 2014 | 386.2 | 26 |
| 2015 | 396.5 | 27 |
| 2016 | 413.7 | 28 |
| 2017 | 428.2 | 29 |
| 2018 | 443.5 | 30 |
| 31 |
FTE calculations count two part-time employees as one full-time employee.
Bureau of Transportation Statistics
All 21 scheduled service passenger airlines
- 443,475 FTEs
- Up 3.6 percent (15,266 FTEs) over July 2017 (428,209 FTEs)
- Up 14.8 percent (57,232 FTEs) over July 2014 (386,243 FTEs)
Four network airlines
- 289,632 FTEs, 65.3 percent of total scheduled passenger airline FTEs
- Up 4.1 percent (11,307 FTEs) over July 2017 (278,325 FTEs)
- Up 12.5 percent (32,091 FTEs) over July 2014 (257,541 FTEs)
Network airlines operate a significant portion of their flights using at least one hub where connections are made for flights to down-line destinations or spoke cities. Note that beginning with January 2018 data, Virgin America’s numbers are included with Alaska Airlines in the network category.
Five low-cost airlines
- 91,305 FTEs, 20.6 percent of total scheduled passenger airline FTEs
- Up 1.9 percent (1,729 FTEs) over July 2017 (89,576 FTEs)
- Up 28.1 percent (20,033 FTEs) over July 2014 (71,272 FTEs)
Low-cost airlines operate under a low-cost business model, with infrastructure and aircraft operating costs below the overall industry average.
10 regional airlines
- 54,590 FTEs, 12.3 percent of total scheduled passenger airline FTEs
- Up 4.2 percent (2,182 FTEs) over July 2017 (52,408 FTEs)
- Up 6.8 percent (3,483 FTEs) over July 2014 (51,107 FTEs)
Regional carriers typically provide service from small cities, using primarily regional jets to support the network carriers’ hub and spoke systems.
Top Employers by Group
- Network: American 102,676 FTEs
- Low-Cost: Southwest 57,866 FTEs
- Regional: SkyWest 13,956 FTEs
Two other airlines
Other carriers generally operate within specific niche markets. They are: Hawaiian Airlines and Sun Country Airlines.
Reporting Notes
Airlines that operate at least one aircraft that has more than 60 seats or the capacity to carry a payload of passengers, cargo and fuel weighing more than 18,000 pounds must report monthly employment statistics.
Data are compiled from monthly reports filed with BTS by commercial air carriers as of August 8. Additional airline employment data and previous releases can be found on the BTS website. BTS has scheduled release of August passenger airline employment data for Oct. 18.