
2015 North American Freight Numbers
Figure 1: U.S.-NAFTA Merchandise Trade by Mode: 2011-2015
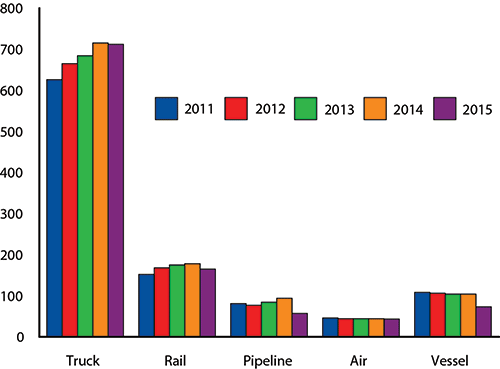
| Mode | 2011 | 2012 | 2013 | 2014 | 2015 | Percent Change between 2014-2015 |
| Truck | 626 | 665 | 684 | 715 | 712 | -0.40% |
| Rail | 152 | 168 | 175 | 178 | 165 | -7.09% |
| Pipeline | 81 | 77 | 84 | 94 | 57 | -39.41% |
| Air | 46 | 44 | 44 | 44 | 43 | -1.84% |
| Vessel | 108 | 106 | 104 | 104 | 73 | -29.66% |
All five major transportation modes – truck, rail, pipeline, vessel and air – carried less U.S. freight with North American Free Trade Agreement (NAFTA) partners Canada and Mexico by value in 2015 than in 2014. The total value of cross-border freight carried on all modes fell 7.2 percent from 2014 to $1.1 trillion in current dollars, according to the U.S. Department of Transportation’s Bureau of Transportation Statistics (BTS) (Figure 1 and Table 1).
The value of commodities moving by truck declined 0.4 percent, the smallest decrease from 2014 to 2015 of any mode, 0.4 percent. The value of freight on other modes also declined: air 1.8 percent; rail 7.1 percent; vessel 29.7 percent; and pipeline 39.4 percent. A drop in the price of crude oil in 2015 played a key role in the large declines in the dollar value of goods shipped by vessel and pipeline. Average monthly prices for crude petroleum and refined fuel are available from the U.S. Energy Information Administration.
The 7.2 percent decline in the value cross-border freight from 2014 to 2015 was almost entirely due to the decline in crude oil and petroleum prices. The value of petroleum-related commodity shipments declined almost 40 percent year-over-year while the value of other freight dropped 0.9 percent. In 2015, petroleum-related commodities comprised 10.8 percent of the total value of U.S. North American freight, down from 16.6 percent in 2014. Some data used to calculate the percentages in this paragraph comes from US International Trade Commission Interactive Tariff and Trade Data, which allows the separation of petroleum and non-petroleum components of mineral fuels.
Figure 2: North American Freight by Mode, 2015
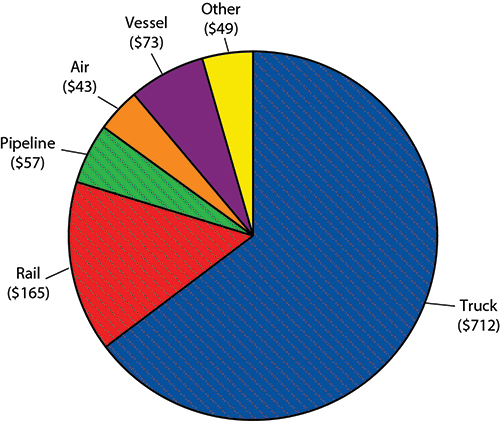
| Mode | 2015 |
| Truck | 712 |
| Rail | 165 |
| Pipeline | 57 |
| Air | 43 |
| Vessel | 73 |
| Other | 49 |
Freight by Mode
Trucks carried 64.3 percent of U.S.-NAFTA freight, a 2.2 percentage point increase from 2005, and continued to be the most heavily utilized mode for moving goods to and from both U.S.-NAFTA partners. Trucks accounted for $359.8 billion of the $589.9 billion of imports (61.0 percent) and for $351.9 billion of the $516.4 billion of exports (68.2 percent) (Table 1).
Rail remained the second largest mode, moving 14.9 percent of all U.S.-NAFTA freight, followed by vessel, 6.6 percent; pipeline, 5.2 percent and air, 3.9 percent. The surface transportation modes of truck, rail and pipeline carried 84.4 percent of the total value of U.S.-NAFTA freight flows (Figure 2, Table 1).
During the last decade, rail’s percentage share rose 0.2 points while pipeline fell 1.4 points (Table 1). The category of all modes of transportation cited in the following tables includes freight movements by truck, rail, vessel, pipeline, air, other, and unknown modes of transport. See North American Transborder Freight Data for historic data.
Freight with Canada
From 2014 to 2015, the value of U.S.-Canada freight flows fell 12.6 percent to $575.2 billion. Trucks carried 58.3 percent of the value of the freight to and from Canada, followed by rail, 15.7 percent; pipeline, 9.3 percent; vessel, 4.9 percent; and air, 4.7 percent. The surface transportation modes of truck, rail and pipeline carried 83.3 percent of the value of total U.S.-Canada freight flows (Table 2).
Trucks carried 58.3 percent of U.S.-Canada freight in 2015, a 0.8 percentage point decrease from 2005. Truck’s share of imports decreased 0.2 percentage points from 2005, while air’s percent share of imports rose 0.7 points and pipeline fell 1.0 points (Table 2).
Michigan led all states in freight with Canada in 2015 with $69.1 billion. Of the top 10 states for U.S.-Canada freight in 2015, Tennessee had the smallest percent decrease over 2014, a 1.3 percent decrease. Illinois had the largest percent decrease over 2014 among the top 10 states, a 29.7 percent decrease (Table 3).
The top commodity category transported between the U.S. and Canada in 2015 was vehicles and vehicle parts (other than railway vehicles and parts) at $103.0 billion with $61.8 billion or 60.0 percent moved by truck (Table 6).
Freight with Mexico
From 2014 to 2015, the value of U.S.-Mexico freight fell 0.6 percent to $531.1 billion. Trucks carried 70.9 percent of the value of the freight to and from Mexico, followed by rail, 14.1 percent; vessel, 8.5 percent; air, 3.1 percent; and pipeline, 0.7 percent. The surface transportation modes of truck, rail and pipeline carried 85.7 percent of the value of total U.S.-Mexico freight flows (Table 4).
Trucks carried 70.9 percent of U.S.-Canada freight in 2015, a 3.5 percentage point increase from 2005. Truck’s share of imports increased 6.3 percentage points from 2005 while vessel’s percentage share of imports fell 10.5 points (Table 4).
Texas led all states in freight with Mexico in 2015 with $178.0 billion. Of the top 10 states for U.S.-Mexico freight in 2015, Pennsylvania had the highest percent change over 2014, a 15.7 percent increase (Table 5).
The top commodity transported between the U.S. and Mexico in 2015 was electrical machinery at $103.8 billion, an increase of 7.5 percent from 2014, with $95.4 billion or 91.9 percent moved by trucks. The next highest commodity category transported by a single mode in U.S.-Mexico freight was vehicles and vehicle parts (other than railway vehicles and parts) with $41.7 billion in freight moved by rail (Table 7).
Reporting Notes
Press releases and the BTS website define surface transportation modes as truck, rail and pipeline. See North American TransBorder Freight Data on the BTS website for additional data for surface modes since 1995 and all modes since 2004. The category for all modes of transportation cited in the following tables includes freight movements by truck, rail, vessel, pipeline, air, other and unknown modes of transport.
Data in this press release are not adjusted for inflation. Additional summary data adjusted for inflation and exchange rates can be found on the BTS website under TransBorder Indexed Freight Flow Data. The BLS indexes used in the adjustments for inflation and exchange rates may be revised in each of the three months after original publication. See TransBorder Freight Data for data from previous months, and more state, port, or commodity data. BTS has scheduled the release of January TransBorder numbers for March 24.
Table 1. Modal Shares of U.S.-NAFTA Freight Flows
Trade by All Modes
(millions of current dollars)
| Mode | 2005 | 2014 | 2015 | Percent Change 2005-2015 | Percent Change 2014-2015 | |
|---|---|---|---|---|---|---|
| All Modes | Imports | 458,068 | 640,220 | 589,931 | 28.8 | -7.9 |
| Exports | 331,469 | 552,451 | 516,394 | 55.8 | -6.5 | |
| Total | 789,537 | 1,192,671 | 1,106,325 | 40.1 | -7.2 |
| Mode | Share of Total by Mode (percent of total value) | Percentage Point Change 2005-2015 | Percentage Point Change 2014-2015 | |||
|---|---|---|---|---|---|---|
| 2005 | 2014 | 2015 | ||||
| All Surface Modes | Imports | 84.3 | 84.5 | 87.3 | 3.0 | 2.8 |
| Exports | 82.2 | 80.6 | 81.1 | -1.1 | 0.5 | |
| Total | 83.4 | 82.7 | 84.4 | 1.0 | 1.7 | |
| Truck | Imports | 55.9 | 54.5 | 61.0 | 5.1 | 6.5 |
| Exports | 70.8 | 66.2 | 68.2 | -2.6 | 1.9 | |
| Total | 62.1 | 59.9 | 64.3 | 2.2 | 4.4 | |
| Rail | Imports | 17.8 | 17.7 | 18.4 | 0.6 | 0.6 |
| Exports | 10.6 | 11.7 | 11.0 | 0.4 | -0.6 | |
| Total | 14.8 | 14.9 | 14.9 | 0.2 | 0.0 | |
| Pipeline | Imports | 10.6 | 12.3 | 8.0 | -2.7 | -4.4 |
| Exports | 0.9 | 2.7 | 1.9 | 1.1 | -0.8 | |
| Total | 6.5 | 7.9 | 5.2 | -1.4 | -2.7 | |
| Vessel | Imports | 9.8 | 9.2 | 6.4 | -3.4 | -2.8 |
| Exports | 4.1 | 8.1 | 6.8 | 2.7 | -1.3 | |
| Total | 7.4 | 8.7 | 6.6 | -0.8 | -2.1 | |
| Air | Imports | 2.7 | 2.9 | 3.0 | 0.3 | 0.1 |
| Exports | 6.2 | 4.6 | 5.0 | -1.3 | 0.4 | |
| Total | 4.2 | 3.7 | 3.9 | -0.3 | 0.2 | |
Source: Bureau of Transportation Statistics, TransBorder Freight Data as of February 2016.
NOTES: Percent change based on numbers prior to rounding. Numbers may not add to totals due to rounding.
The percentage of modal share for all surface modes equals the sum of the share of the truck, rail and pipeline modes.
Table 2. Modal Shares of U.S.-Canada Freight Flows
Trade by All Modes
(millions of current dollars)
| Mode | 2005 | 2014 | 2015 | Percent Change 2005-2015 | Percent Change 2014-2015 | |
|---|---|---|---|---|---|---|
| All Modes | Imports | 287,870 | 346,063 | 295,190 | 2.5 | -14.7 |
| Exports | 211,420 | 312,125 | 280,017 | 32.4 | -10.3 | |
| Total | 499,291 | 658,188 | 575,207 | 15.2 | -12.6 |
| Mode | Share of Total by Mode (percent of total value) | Percentage Point Change 2005-2015 | Percentage Point Change 2014-2015 | |||
|---|---|---|---|---|---|---|
| 2005 | 2014 | 2015 | ||||
| All Surface Modes | Imports | 87.9 | 85.9 | 86.7 | -1.2 | 0.8 |
| Exports | 81.8 | 80.1 | 79.7 | -2.1 | -0.4 | |
| Total | 85.3 | 83.1 | 83.3 | -2.0 | 0.2 | |
| Truck | Imports | 49.9 | 43.1 | 49.7 | -0.2 | 6.6 |
| Exports | 71.5 | 65.6 | 67.3 | -4.2 | 1.7 | |
| Total | 59.1 | 53.8 | 58.3 | -0.8 | 4.5 | |
| Rail | Imports | 21.1 | 20.0 | 21.1 | 0.1 | 1.1 |
| Exports | 9.1 | 11.1 | 10.1 | 0.9 | -1.1 | |
| Total | 16.0 | 15.8 | 15.7 | -0.3 | -0.1 | |
| Pipeline | Imports | 16.9 | 22.8 | 15.8 | -1.1 | -6.9 |
| Exports | 1.1 | 3.3 | 2.3 | 1.2 | -1.0 | |
| Total | 10.2 | 13.5 | 9.3 | -1.0 | -4.3 | |
| Vessel | Imports | 4.9 | 6.0 | 5.1 | 0.3 | -0.9 |
| Exports | 2.0 | 5.7 | 4.6 | 2.6 | -1.1 | |
| Total | 3.7 | 5.9 | 4.9 | 1.2 | -1.0 | |
| Air | Imports | 2.9 | 3.3 | 3.7 | 0.7 | 0.4 |
| Exports | 6.7 | 5.4 | 5.7 | -1.0 | 0.3 | |
| Total | 4.6 | 4.3 | 4.7 | 0.1 | 0.4 | |
Source: Bureau of Transportation Statistics, TransBorder Freight Data as of February 2016.
NOTES: Percent change based on numbers prior to rounding. Numbers may not add to totals due to rounding.
The percentage of modal share for all surface modes equals the sum of the share of the truck, rail and pipeline modes.
Table 3. Top 10 States Trading with Canada by All Modes of Transportation
Ranked by 2015 Value
(millions of current dollars)
| State | 2014 | 2015 | Percent Change 2014 -2015 | ||
|---|---|---|---|---|---|
| Value | Rank | Value | Rank | ||
| Michigan | 74,249 | 1 | 69,059 | 1 | -7.0 |
| Illinois | 67,086 | 2 | 47,166 | 2 | -29.7 |
| California | 46,129 | 4 | 44,783 | 3 | -2.9 |
| Texas | 48,551 | 3 | 41,311 | 4 | -14.9 |
| Ohio | 37,785 | 5 | 33,913 | 5 | -10.3 |
| New York | 34,168 | 6 | 30,413 | 6 | -11.0 |
| Pennsylvania | 24,707 | 8 | 22,302 | 7 | -9.7 |
| Washington | 25,264 | 7 | 21,548 | 8 | -14.7 |
| Indiana | 20,338 | 9 | 18,819 | 9 | -7.5 |
| Tennessee | 14,595 | 12 | 14,406 | 10 | -1.3 |
Source: Bureau of Transportation Statistics, TransBorder Freight Data as of February 2016.
NOTE: Percent change based on numbers prior to rounding.
Table 4. Modal Shares of U.S.-Mexico Freight Flows
Trade by All Modes
(millions of current dollars)
| Mode | 2005 | 2014 | 2015 | Percent Change 2005-2015 | Percent Change 2014-2015 | |
|---|---|---|---|---|---|---|
| All Modes | Imports | 170,198 | 294,157 | 294,741 | 73.2 | 0.2 |
| Exports | 120,049 | 240,326 | 236,377 | 96.9 | -1.6 | |
| Total | 290,247 | 534,484 | 531,118 | 83.0 | -0.6 |
| Mode | Share of Total by Mode (percent of total value) | Percentage Point Change 2005-2015 | Percentage Point Change 2014-2015 | |||
|---|---|---|---|---|---|---|
| 2005 | 2014 | 2015 | ||||
| All Surface Modes | Imports | 78.2 | 82.9 | 88.0 | 9.8 | 5.1 |
| Exports | 83.0 | 81.3 | 82.7 | -0.2 | 1.4 | |
| Total | 80.2 | 82.2 | 85.7 | 5.5 | 3.5 | |
| Truck | Imports | 66.0 | 67.9 | 72.3 | 6.3 | 4.4 |
| Exports | 69.4 | 67.0 | 69.1 | -0.3 | 2.1 | |
| Total | 67.4 | 67.5 | 70.9 | 3.5 | 3.4 | |
| Rail | Imports | 12.2 | 15.0 | 15.6 | 3.4 | 0.6 |
| Exports | 13.1 | 12.3 | 12.1 | -1.0 | -0.2 | |
| Total | 12.6 | 13.8 | 14.1 | 1.5 | 0.3 | |
| Pipeline | Imports | 0.0 | 0.1 | 0.1 | 0.1 | 0.0 |
| Exports | 0.5 | 2.0 | 1.5 | 1.0 | -0.5 | |
| Total | 0.2 | 0.9 | 0.7 | 0.5 | -0.2 | |
| Vessel | Imports | 18.2 | 13.0 | 7.7 | -10.5 | -5.3 |
| Exports | 7.8 | 11.3 | 9.4 | 1.7 | -1.8 | |
| Total | 13.9 | 12.2 | 8.5 | -5.4 | -3.7 | |
| Air | Imports | 2.3 | 2.4 | 2.2 | 0.0 | -0.1 |
| Exports | 5.4 | 3.6 | 4.1 | -1.2 | 0.5 | |
| Total | 3.6 | 2.9 | 3.1 | -0.5 | 0.2 | |
Source: Bureau of Transportation Statistics, TransBorder Freight Data as of February 2016.
NOTES: Percent change based on numbers prior to rounding. Numbers may not add to totals due to rounding.
The percentage of modal share for all surface modes equals the sum of the share of the truck, rail and pipeline modes.
Table 5. Top 10 States Trading with Mexico by All Modes of Transportation
Ranked by 2015 Value
(millions of current dollars)
| State | 2014 | 2015 | Percent Change 2014 -2015 | ||
|---|---|---|---|---|---|
| Value | Rank | Value | Rank | ||
| Texas | 192,761 | 1 | 177,997 | 1 | -7.7 |
| California | 66,669 | 2 | 71,889 | 2 | 7.8 |
| Michigan | 53,283 | 3 | 55,009 | 3 | 3.2 |
| Illinois | 21,272 | 4 | 22,195 | 4 | 4.3 |
| Arizona | 15,943 | 5 | 16,760 | 5 | 5.1 |
| Ohio | 13,797 | 6 | 14,683 | 6 | 6.4 |
| Tennessee | 11,486 | 7 | 11,995 | 7 | 4.4 |
| Indiana | 10,153 | 9 | 10,059 | 8 | -0.9 |
| Georgia | 9,049 | 10 | 9,732 | 9 | 7.5 |
| Pennsylvania | 7,254 | 14 | 8,392 | 10 | 15.7 |
Source: Bureau of Transportation Statistics, TransBorder Freight Data as of February 2016.
NOTE: Percent change based on numbers prior to rounding.
Table 6. Top Commodity Transported between the U.S. and Canada for Each Mode of Transportation, 2015
(millions of current dollars)
| Mode | Commodities | Exports | Imports | Total |
|---|---|---|---|---|
| All Modes | Vehicles Other than Railway | 47,594 | 55,403 | 102,997 |
| Truck | Vehicles Other than Railway | 33,939 | 27,857 | 61,796 |
| Rail | Vehicles Other than Railway | 11,118 | 27,460 | 38,578 |
| Pipeline | Mineral Fuels; Oils and Waxes | 6,390 | 46,554 | 52,943 |
| Vessel | Mineral Fuels; Oils and Waxes | 11,042 | 12,163 | 23,205 |
| Air | Electrical Machinery; Equipment and Parts | 3,537 | 1,649 | 5,185 |
Source: Bureau of Transportation Statistics, TransBorder Freight Data as of February 2016.
Note: Numbers may not add to totals due to rounding.
Table 7. Top Commodity Transported between the U.S. and Mexico for Each Mode of Transportation, 2015
(millions of current dollars)
| Mode | Commodities | Exports | Imports | Total |
|---|---|---|---|---|
| All Modes | Electrical Machinery; Equipment and Parts | 41,086 | 62,692 | 103,778 |
| Truck | Electrical Machinery; Equipment and Parts | 36,840 | 58,571 | 95,410 |
| Rail | Vehicles Other than Railway | 7,680 | 34,017 | 41,697 |
| Pipeline | Mineral Fuels; Oils and Waxes | 3,460 | 221 | 3,681 |
| Vessel | Mineral Fuels; Oils and Waxes | 13,065 | 13,200 | 26,265 |
| Air | Electrical Machinery; Equipment and Parts | 3,063 | 2,059 | 5,122 |
Source: Bureau of Transportation Statistics, TransBorder Freight Data as of February 2016.
Note: Numbers may not add to totals due to rounding.