
2018 Freight Flow Estimates
Thursday, December 19, 2019 – Freight shipments in the U.S. grew from 2017 to 2018, up 3.8% by weight to 18.6 billion tons and up 3.1% by value to $18.9 trillion, according to annual estimates from the Freight Analysis Framework (FAF).
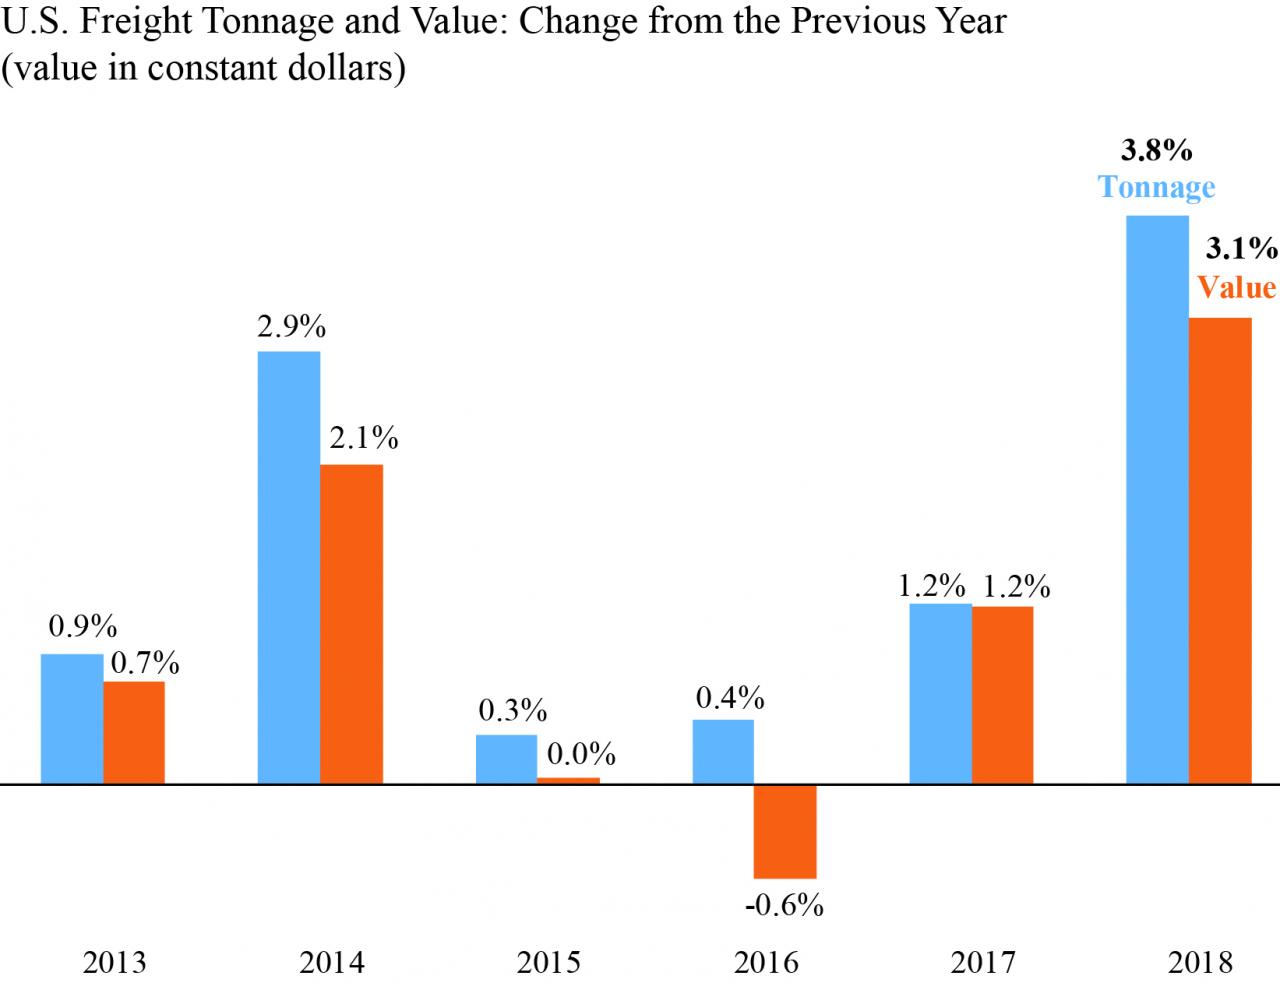
Growth by weight: Tonnage increased 3.8% from 17.9 billion tons in 2017 to 18.6 billion tons in 2018, the largest one-year percentage rise in the most recent five-year period. Tonnage rose 8.9% from 2013 to 2018 for an average growth rate of 1.7% per year. Much of the tonnage growth was due to increased shipments of construction materials, such as sand and gravel, as well as energy goods like crude oil and natural gas.
Growth by value (measured in 2012-based constant dollars): The value of U.S. freight shipments rose 3.1% from $18.3 trillion in 2017 to $18.9 trillion in 2018, the largest one-year percentage rise in the most recent five-year period. The total growth in value from 2013 was 5.9%, an average of 1.2% per year. Growth in value was driven by increases in crude oil, natural gas, pharmaceuticals, machinery, electronics, and motor vehicles.
Modal shipments: Truck continues to move most U.S. freight – 64% of tonnage and 69% of value. Additional tonnage and value is carried by truck as part of intermodal shipments. Also, truck accounts for the greatest share (39%) of ton-miles – the movement of one ton for one mile – but other modes are more frequently used to handle very heavy shipments moving long distances. Rail has a 27% share of ton-miles because of its role in transporting grain, coal and chemicals. With a large volume of fossil fuels, pipeline transportation accounts for 19% of total ton-miles.
The FAF is a comprehensive accounting of freight movement in the U.S. It is rooted in the Commodity Flow Survey (CFS), a survey conducted every five years that measures freight activity for the mining, manufacturing, and wholesale sectors, as well as other selected industries. The FAF includes information for industries not covered by the CFS, as well as imports and exports, to create a comprehensive picture of freight movement among states and major metropolitan areas by all modes of transportation. For more current numbers, the Freight Transportation Services Index measures monthly changes in for-hire freight shipments using primarily industry data sources for ton-miles and tonnage.
The FAF program is jointly administered by the Bureau of Transportation Statistics and the Federal Highway Administration. The full array of FAF products are now available, which includes data for recent years, geospatial network and truck flows, ton-miles, and the historical series. Media contact: Dave Smallen, (202) 366-5568.