
2021 North American Trade Value Reaches $1.3 Trillion, up 8% from Pre-pandemic 2019, up 25% from 2020
BTS 09-22
December 2021 North American Trade Valued at $117.5 Billion, up 22% from Pre-Pandemic December 2019
Full-year 2021 transborder freight between the U.S. and North American countries (Canada and Mexico):
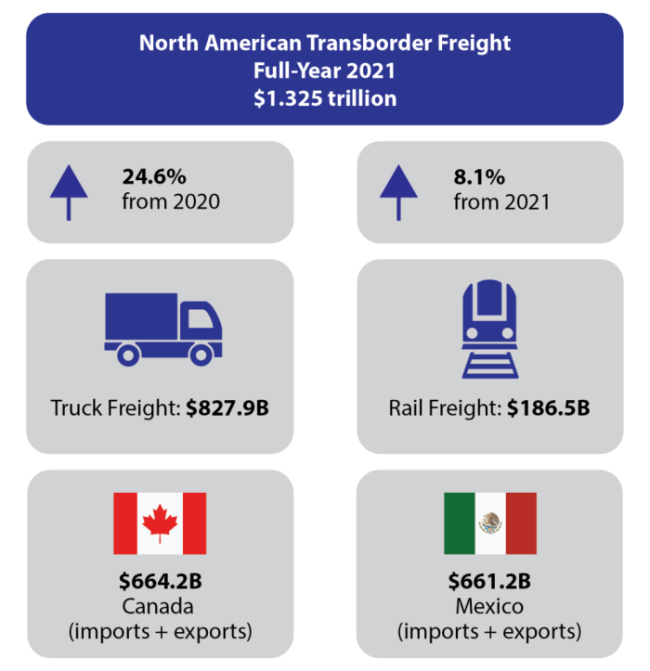
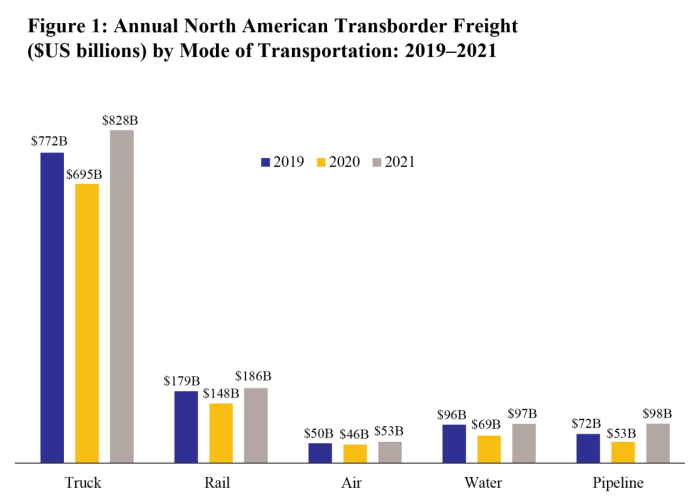
- Total transborder freight: $1.33 trillion of transborder freight moved by all modes of transportation, up 8% compared to pre-pandemic 2019, up 24.6% compared to 2020.
- Freight between the U.S. and Canada totaled $664.2B. Freight between the U.S. and Mexico totaled $661.2B.
- Trucks moved $827.9 billion of freight, up 7.2% from 2019 and 19.2% from 2020.
- Railways moved $186.5 billion of freight, up % 4.4% from 2019 and 25.6% from 2020.
- The port of Laredo, TX, saw the most freight value moved between the U.S. and Mexico ($242.9 billion). Detroit, MI, saw the most freight moved between the U.S. and Canada ($131.3 billion).
- The top export to Canada was Computer-Related Parts and Machinery ($44.2 billion) followed closely by Vehicles Other than Railway (also $44.2 billion), and the top import from Canada was Mineral Fuels, Oils, and Waxes ($103.2 billion).
- The top export to Mexico was Electrical Machinery Equipment and Parts ($43.4 billion), and the top import from Mexico was Vehicles Other than Railway ($93.7 billion).
Transborder freight in December 2021:
- Total transborder freight: $117.5 billion of transborder freight moved by all modes of transportation, up 22.0% compared to pre-pandemic December 2019 and up 21.5% compared to December 2020.
- Freight between the U.S. and Canada totaled $60.6B, up 21.9% from December 2019 and up 27.4% from December 2020. Freight between the U.S. and Mexico totaled $57.0B, up 22.1% from December 2019 and up 15.8% from December 2020.
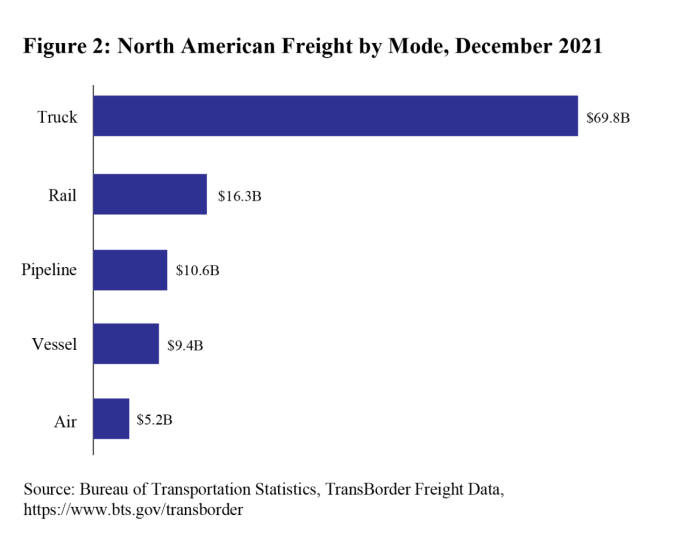
- Trucks moved $69.8 billion of freight, up 22.0% from December 2019 and up 15.3% from December 2020.
- Railways moved $16.3 billion of freight, up 13.2% from December 2019 and 15.5% from December 2020.
Total Transborder Freight by Border and Mode:
|
U.S.-Canada (both directions) |
U.S.-Mexico (both directions) |
Truck Freight: $69.8 billion (59.4% of all transborder freight)
- U.S.-Canada: $30.8 billion (50.9% of all northern border freight)
- U.S.-Mexico: $39.0 billion (68.4% of all southern border freight)
- Top three busiest truck border ports (45.1% of total transborder truck freight)
- Laredo, TX $16.8 billion
- Detroit, MI $9.2 billion
- Port Huron, MI $5.5 billion
- Top three truck commodities (47.3% of total transborder truck freight)
- Computers and parts $13.3 billion
- Electrical machinery $10.8 billion
- Vehicles and parts $9.0 billion
Rail Freight: $16.3 billion (13.9% of all transborder freight)
- U.S.-Canada: $8.9 billion (14.7% of all northern border freight)
- U.S.-Mexico: $7.4 billion (13.0% of all southern border freight)
- Three busiest rail border ports (49.9% of total transborder rail freight)
- Laredo, TX $3.8 billion
- Port Huron, MI $2.2 billion
- Eagle Pass, TX $2.1 billion
- Top three rail commodities (54.2% of total transborder rail freight)
- Vehicles and parts $6.4 billion
- Mineral fuels $1.3 billion
- Plastics and articles $1.1 billion
Reporting Notes
Data in this Bureau of Transportation Statistics release are not seasonally adjusted and are not adjusted for inflation. For previous statistical releases and summary tables, see transborder releases. See transborder freight data for data from previous months, and for additional state, port, and commodity data. BTS has scheduled the release of January transborder numbers for March 12, 2022.