
2022 2nd Quarter U.S. Airline Financial Data
BTS 37 -22
U.S. airline financial reports are filed quarterly with the Bureau of Transportation Statistics (BTS). See the tables that accompany this release on the BTS website for additional second quarter (Tables 1-6) financial results.
2Q 2022 Results for All 25 Scheduled U.S. Passenger Airlines
U.S. scheduled passenger airlines reported a second-quarter 2022 after-tax net income of $2.2 billion and a pre-tax operating income of $4.7 billion.
One year earlier, in the second quarter of 2021, the airlines reported an after-tax net income of $1.0 billion and a pre-tax operating loss of $3.6 billion.
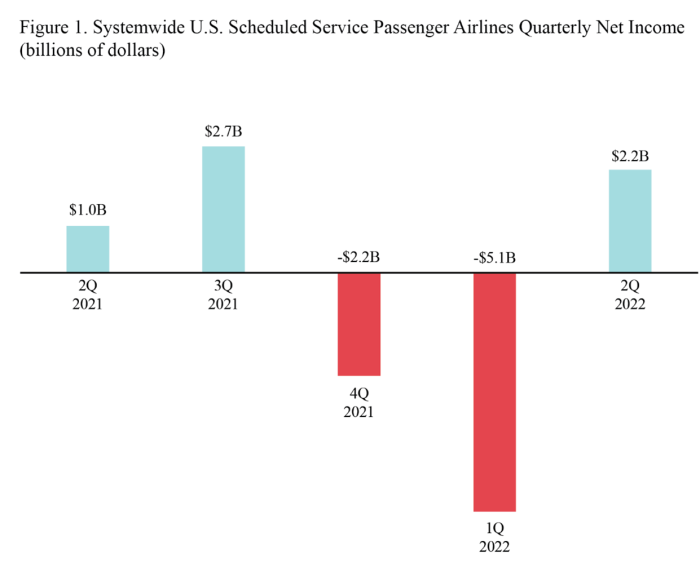
After-tax net income
- $2.2 billion profit in 2Q 2022
- Compared to $5.1 billion loss in 1Q 2022
- Compared to $1.0 billion profit in 2Q 2021
Pre-tax operating profit
- $4.7 billion profit in 2Q 2022
- Compared to $5.2 billion loss in 1Q 2022
- Compared to $3.6 billion loss in 2Q 2021
- Total 2Q 2022 operating revenue: $57.5 billion
- Share of total 2Q 2022 operating revenue:
- Fares: $42.1 billion, 73.2%, compared to 65.5% in 2Q 2021
- Baggage fees: $1.8 billion, 3.1%, compared to 4.4% in 2Q 2021
- Reservation change fees: $252 million, 0.4%, compared to 0.3% in 2Q 2021
- Share of total 2Q 2022 operating revenue:
Fees are included for calculations of net income, operating revenue and operating profit or loss.
- Total 2Q 2022 operating expenses: $52.8 billion:
- Share of total 2Q 2022 operating expenses:
- Fuel: $14.0 billion, 26.5%, compared to 15.6% in 2Q 2021
- Labor: $15.6 billion, 29.6%, compared to 35.7% in 2Q 2021
- Share of total 2Q 2022 operating expenses:
Domestic operations, includes 25 U.S. airlines:
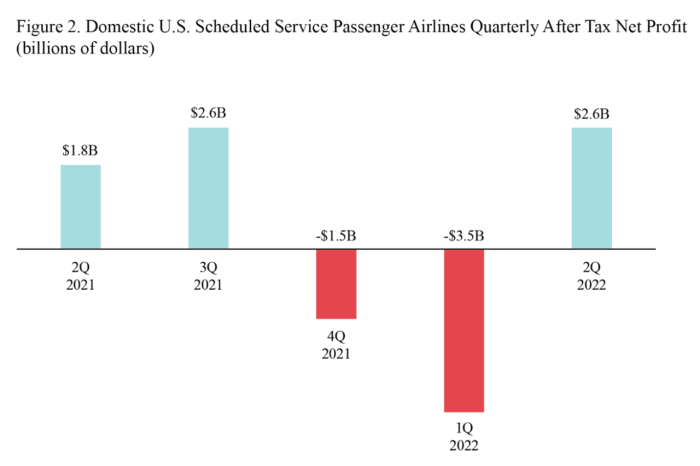
After-tax domestic net profit (net income)
- $2.6 billion profit in 2Q 2022
- Compared to $3.5 billion loss in 1Q 2022
- Compared to $1.8 billion profit in 2Q 2021
Pre-tax domestic operating profit
- $4.6 billion profit in 2Q 2022
- Compared to $3.6 billion loss in 1Q 2022
- Compared to $2.1 billion loss in 2Q 2021
- 2Q 2022 domestic operating revenue: $45.1 billion
- Share of total 2Q 2022 domestic operating revenue:
- Fares: $32.1 billion, 71.2%, compared to 65.7% in 2Q 2021
- Baggage fees: $1.4 billion, 3.2%, compared to 4.3% in 2Q 2021
- Reservation change fees: $218 million, 0.5%, compared to 0.5% in 2Q 2021
- Share of total 2Q 2022 domestic operating revenue:
Fees are included for calculations of net income, operating revenue and operating profit or loss.
- 2Q 2022 domestic operating expenses: $40.5 billion, of which:
- Share of total 2Q 2022 domestic operating expenses:
- Fuel: $9.8 billion, 24.2%, compared to 14.6% in 2Q 2021
- Labor: $11.9 billion, 29.5%, compared to 34.8% in 2Q 2021
- Share of total 2Q 2022 domestic operating expenses:
International operations, includes 20 U.S. airlines:
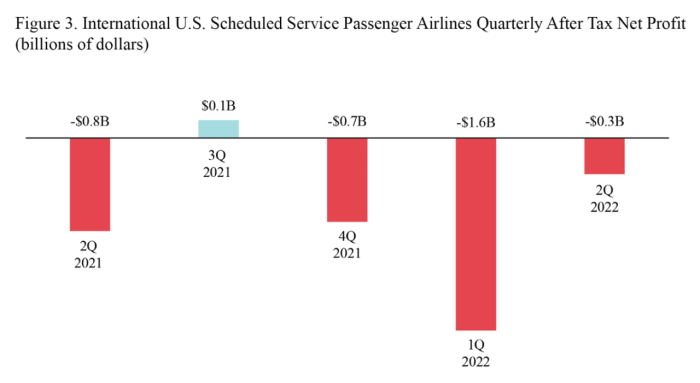
After-tax international net profit (net income)
- $347 million loss in 2Q 2022
- Compared to $1.6 billion loss in 1Q 2022
- Compared to $774 million loss in 2Q 2021
Pre-tax international operating profit
- $99 million profit in 2Q 2022
- Compared to $1.6 billion loss in 1Q 2022
- Compared to $1.5 billion loss in 2Q 2021
- 2Q 2022 international operating revenue: $12.4 billion, of which:
- Share of 2Q 2022 international operating revenue:
- Fares: $10.0 billion, 80.3%, compared to 64.6% in 2Q 2021
- Baggage fees: $350 million, 2.8%, compared to 4.9% in 2Q 2021
- Reservation change fees: $34 million, 0.3%, compared to 0.3% in 2Q 2021
- Share of 2Q 2022 international operating revenue:
Fees are included for calculations of net income, operating revenue and operating profit or loss.
- 2Q 2022 international operating expenses: $12.3 billion, of which:
- Share of 2Q 2022 international operating expenses:
- Fuel: $4.2 billion, 34.0%, compared to 20.0% in 2Q 2021
- Labor: $3.7 billion, 30.0%, compared to 39.3% in 2Q 2021
- Share of 2Q 2022 international operating expenses:
2nd Quarter Margins
Net margin is the net income or loss as a percentage of operating revenue. Operating margin is the operating profit or loss as a percentage of operating revenue.
Systemwide:
Net income margin:
- 3.9% in 2Q2022
- Compared to 3.2% in 2Q2021
Operating margin:
- 8.2% in 2Q2022
- Compared to -11.4% in 2Q2021
Domestic
Net income margin:
- 5.7% in 2Q2022
- Compared to 6.7% in 2Q2021
Operating margin:
- 10.2% in 2Q2022
- Compared to -8.0% in 2Q2021
International
Net income margin:
- -2.8% in 2Q2022
- Compared to -15.1% in 2Q2021
Operating margin:
- 0.8% in 2Q2022
- Compared to -28.8% in 2Q2021
Reporting notes
Additional data: BTS website, see tables for operating profit/loss, operating revenue and fuel cost and consumption. See the BTS financial databases for more detailed data including numbers for individual airlines.
Filing requirement: By regulation, for the quarter ending Jun. 30, airlines that operate at least one aircraft that is designed/certified for more than 60 seats or the capacity to carry a payload of passengers and cargo weighing more than 18,000 pounds must report financial data to BTS by June 30. The airline filings are subject to a process of quality assurance and data validations before release to the public.
Data updates: Revised carrier data and late data filings will be made available monthly on TranStats on the Monday following the second Tuesday of the month. All data are subject to revision. BTS will release third-quarter 2022 data on December 5.