
April Airline Industry Employment Down 1% from March
Contact: Dave Smallen
david.smallen@dot.gov
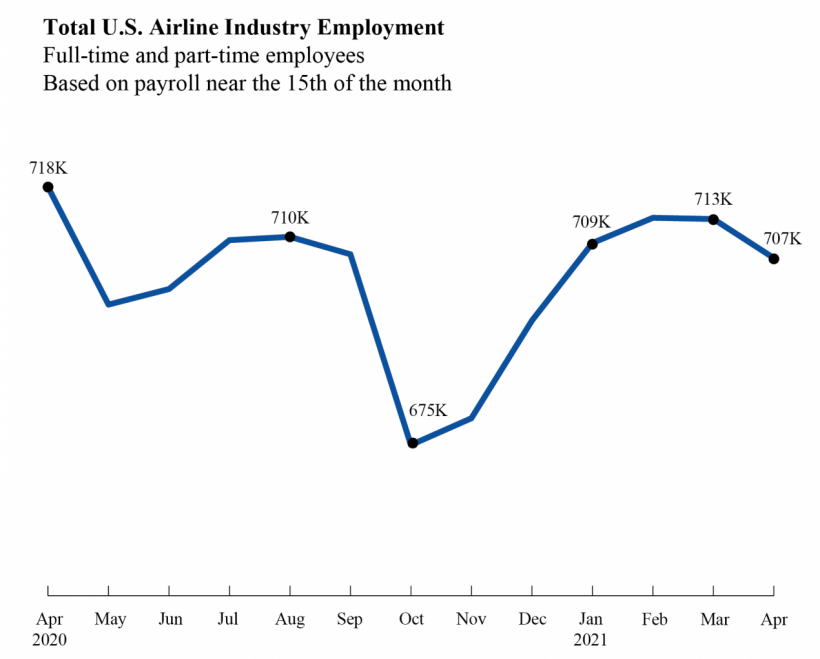
U.S. airlines employed 706,504 workers in April 2021, 6,531 fewer than in March 2021 (713,035) and 48,591 fewer than in March 2020 (755,095).
The April industry numbers consist of 592,931 full-time and 113,573 part-time workers.
The largest March to April reductions among major airlines were American Airlines, down 2,410 employees, and SkyWest Airlines, down 2,329 employees. From the start of the pandemic in March 2020, the largest employment reductions were Delta Air Lines, down 24,321 employees, and United Airlines, down 23,632 employees. From March 2020 to April 2021, Federal Express added 24,392 employees.
Regulations require airlines to report employment numbers to the Bureau of Transportation Statistics for employees who worked or received pay for any part of the pay period(s) ending nearest the 15th day of the month. Numbers include all paid employees but do not include employees not being paid.
Total employment (full-time + part-time) by U.S. airlines (passenger + cargo carriers):
April 2020 718,385
March 2021 713,035
April 2021 706,504
Major Airlines' Total Employees, March 2020 and April 2021
Includes Full-time and Part-time Employees
| 20-Mar | 21-Apr | Change in Employees | Percent Change | |
| Alaska | 17,912 | 16,631 | -1,281 | -7.2 |
| Allegiant | 4,487 | 4,195 | -292 | -6.5 |
| American | 109,108 | 98,893 | -10,215 | -9.4 |
| Atlas | 3,121 | 3,546 | 425 | 13.6 |
| Delta | 89,980 | 65,659 | -24,321 | -27 |
| Envoy | 16,781 | 15,447 | -1,334 | -7.9 |
| Federal Express | 245,010 | 269,402 | 24,392 | 10 |
| Frontier | 5,181 | 4,995 | -186 | -3.6 |
| Hawaiian | 7,492 | 5,729 | -1,763 | -23.5 |
| JetBlue | 21,546 | 18,851 | -2,695 | -12.5 |
| Kalitta | 2,013 | 2,290 | 277 | 13.8 |
| Polar Air Cargo | 226 | 246 | 20 | 8.8 |
| Republic | 6,519 | 5,499 | -1,020 | -15.6 |
| SkyWest | 20,544 | 17,448 | -3,096 | -15.1 |
| Southwest | 62,081 | 56,680 | -5,401 | -8.7 |
| Spirit | 9,213 | 8,872 | -341 | -3.7 |
| United | 91,563 | 67,931 | -23,632 | -25.8 |
| United Parcel Service | 6,279 | 6,539 | 260 | 4.1 |
| Major Airline Total | 719,056 | 668,853 | -50,203 | -7 |
Source: Bureau of Transportation Statistics, Airline Employment Data (P1a)
Major Carrier: Over $1 billion annual operating revenue
Additional individual airline numbers are available on the BTS airline employment web page. The web page provides full-time and part-time employment numbers by carrier by month from 1990 through April 2021.
Reports are from all U.S. airlines including scheduled passenger, charter and cargo that meet the reporting standard. Airlines that operate at least one aircraft that has more than 60 seats or the capacity to carry a payload of passengers, cargo and fuel weighing more than 18,000 pounds must report monthly employment statistics.
The next web update for full-time and part-time employment is scheduled for July 8. The BTS press release on full-time equivalent employment for scheduled passenger airlines through April, with historic comparisons and summary tables will be issued June 17.
-END-