
Bikeshare Ridership Down 44% During COVID-19
Date: Wednesday, July 8, 2020
Ridership on eight of the nation’s largest docked bikeshare systems in the COVID-19 months of March through May 2020 declined by 44% compared to the same period in 2019, according to data from the U.S. Department of Transportation’s Bureau of Transportation Statistics released today in a new interactive map. San Francisco (Bay Wheels) experienced the largest decline at 60% (Figure 1).
There were 4.5 million trips on the eight bikeshare systems in 2020, down from 8.1 million trips in 2019.
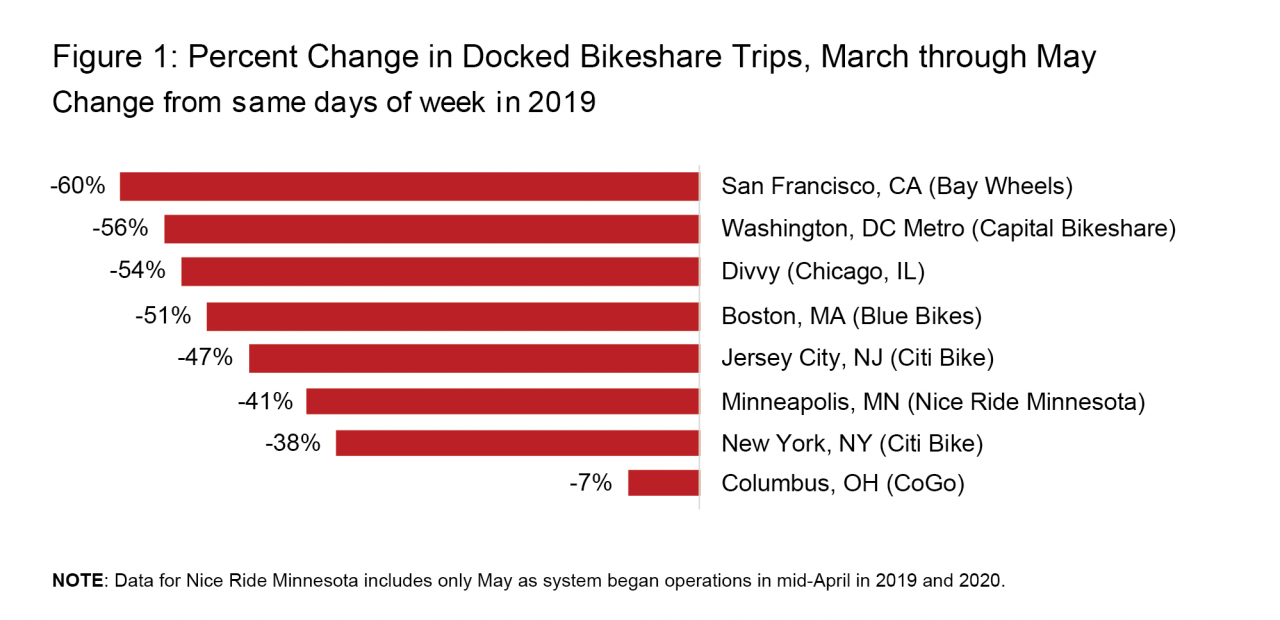
Three areas accounted for about 85% of all bikeshare trips in March through May 2019 and 2020 – New York (Citi Bike) (down 38%), Washington D.C. area (Capital Bikeshare) (down 56%), and Chicago (Divvy) (down 54%) (Figure 1).
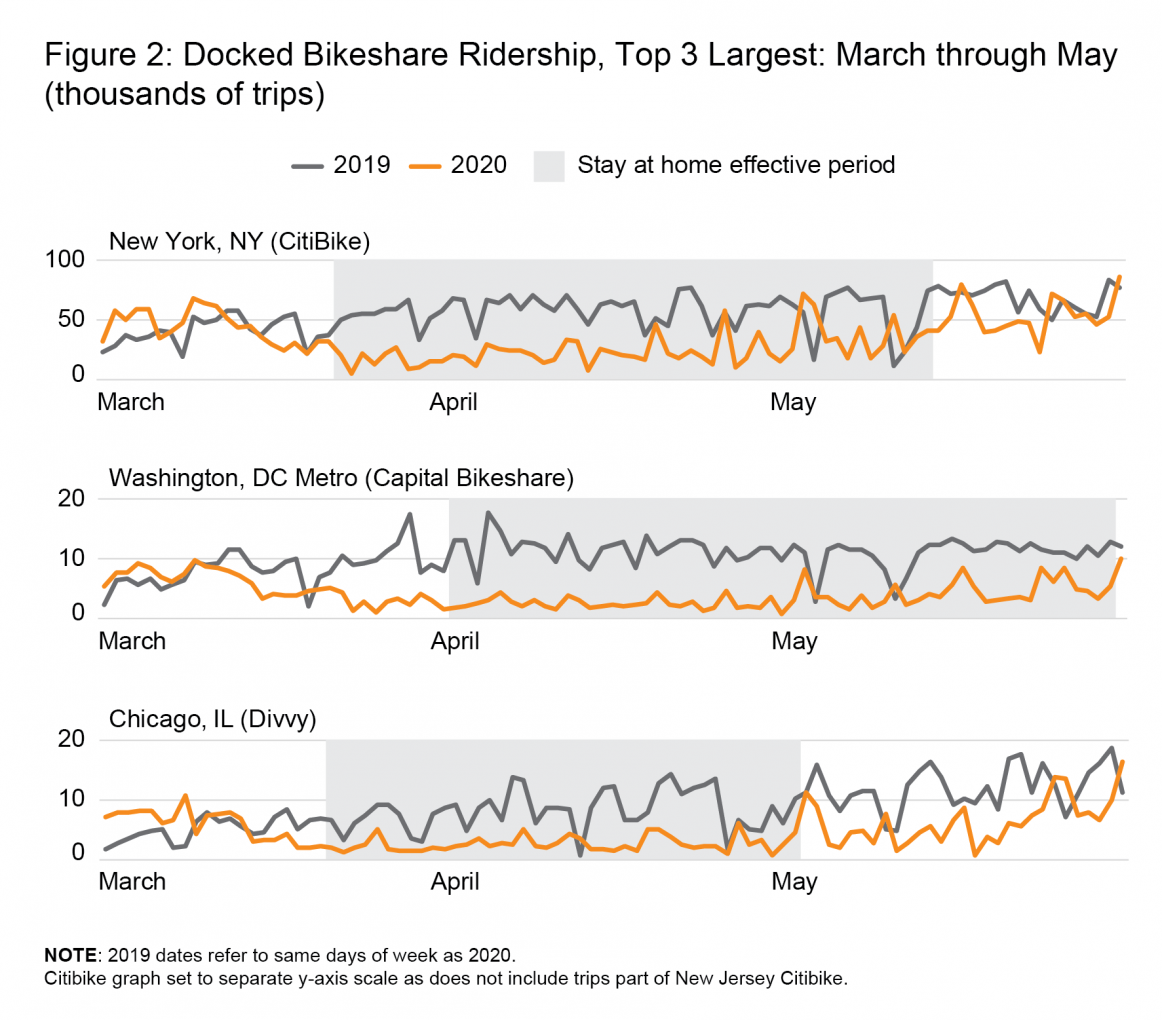
Docked bikeshare ridership in New York and Chicago declined shortly after statewide stay at home orders, while docked bikeshare ridership in the Washington, D.C. area fell in advance (figure 2).
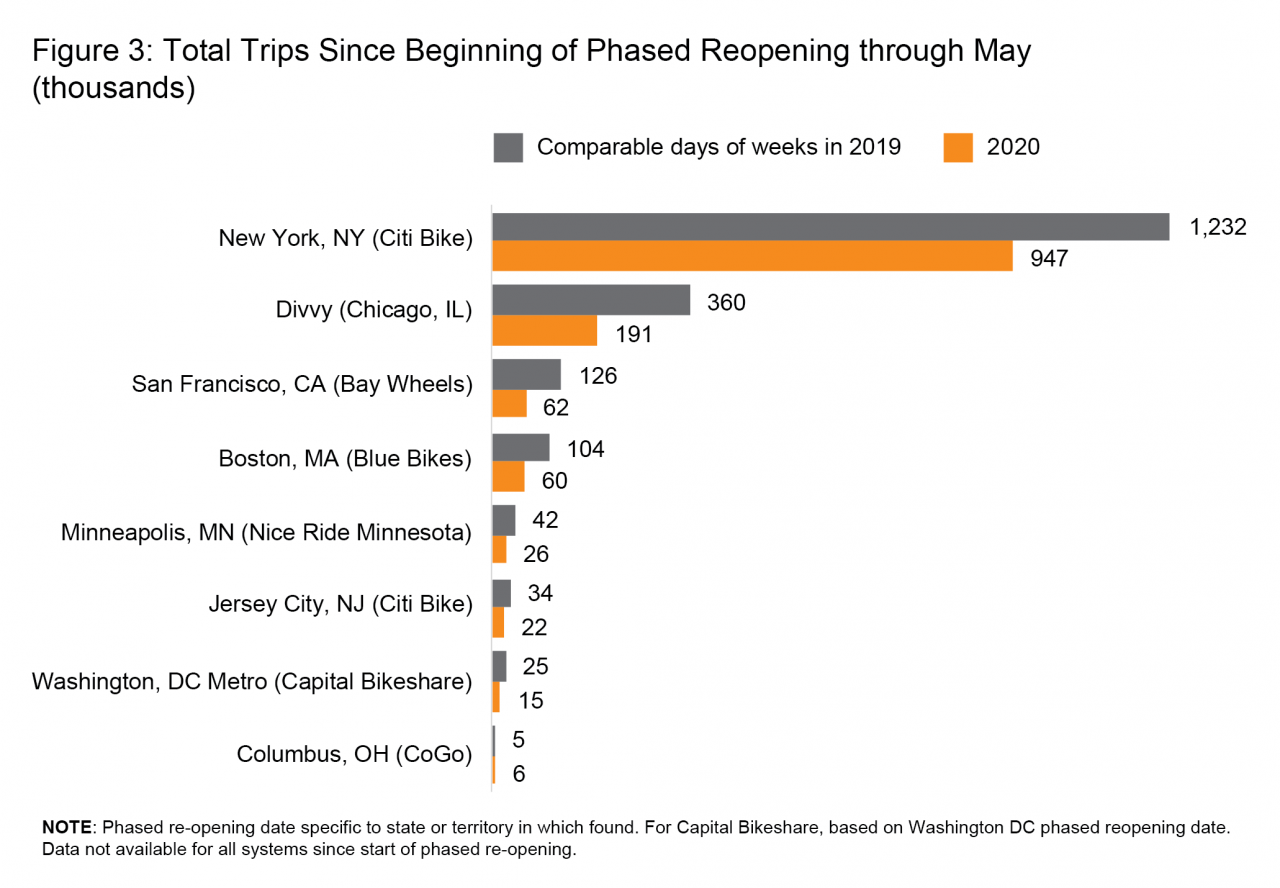
Ridership began to increase in some areas following phased re-opening. However, total trips since the beginning of phased re-opening through May remain below the comparable days of weeks in 2019 across all areas, except Columbus, OH (figure 3). In Columbus, total trips in the days since re-opening exceed totals for the comparable days in 2019 by just over 1,000 trips.
Docked bikeshare accounted for 43% of the 84 million trips by docked or dockless bikeshare or e-scooter in 2018.
BTS’ interactive docked bikeshare ridership map shows, by area served, the total number of trips taken by month from January through May 2020 compared to the same days of the week in 2019. The map includes a graph showing the total number of trips in a month and for a selected area, a second graph showing the total number of trips by day. The map can be zoomed to the locations of the docking stations at the street level, for which a side-by-side map appears to show the percent of trips ending at the station in 2019 and 2020. The side-by-side map visualizes year-over-year changes in stations and areas of the city most frequented. The map features the largest bikeshare systems.