Commodity Flow Survey 2017
American manufacturers, wholesalers, and other selected industries shipped nearly 12.5 billion tons of goods valued at more than $14.3 trillion in 2017, according to preliminary numbers from the 2017 Commodity Flow Survey (CFS) released today.
On a typical day in 2017, establishments in these industries moved 34.2 million tons of goods, valued at $39.2 billion, and generated nearly 8.6 billion ton-miles on the nation's transportation network.
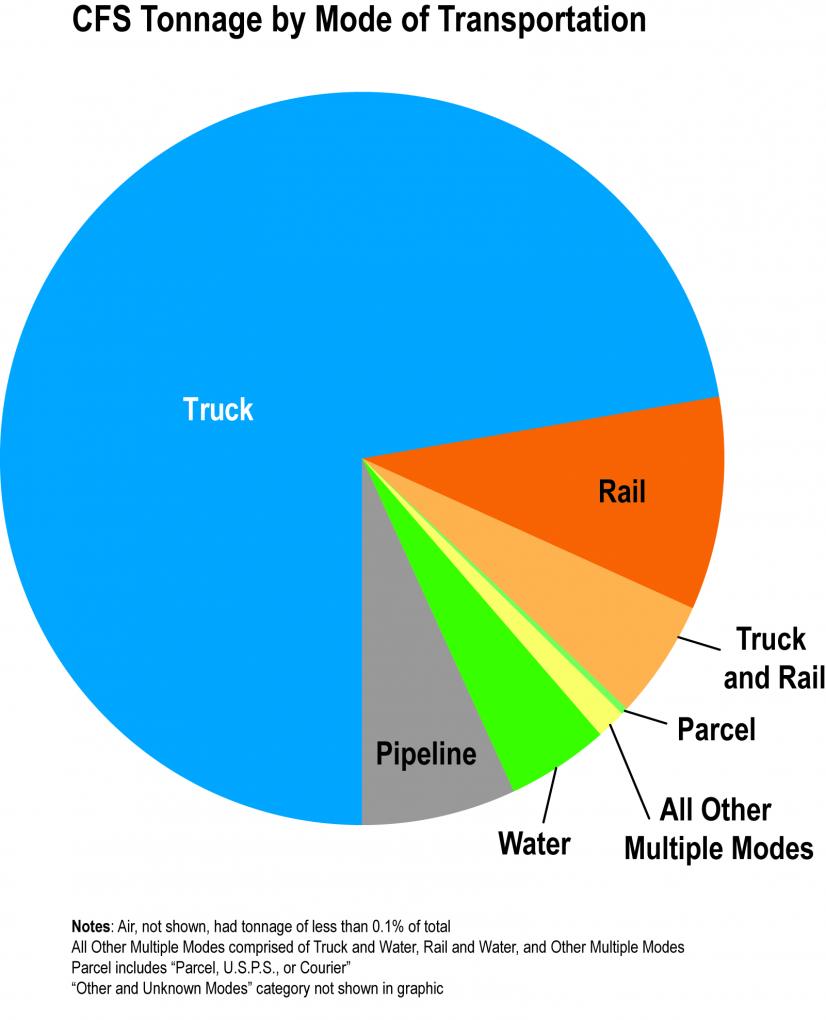
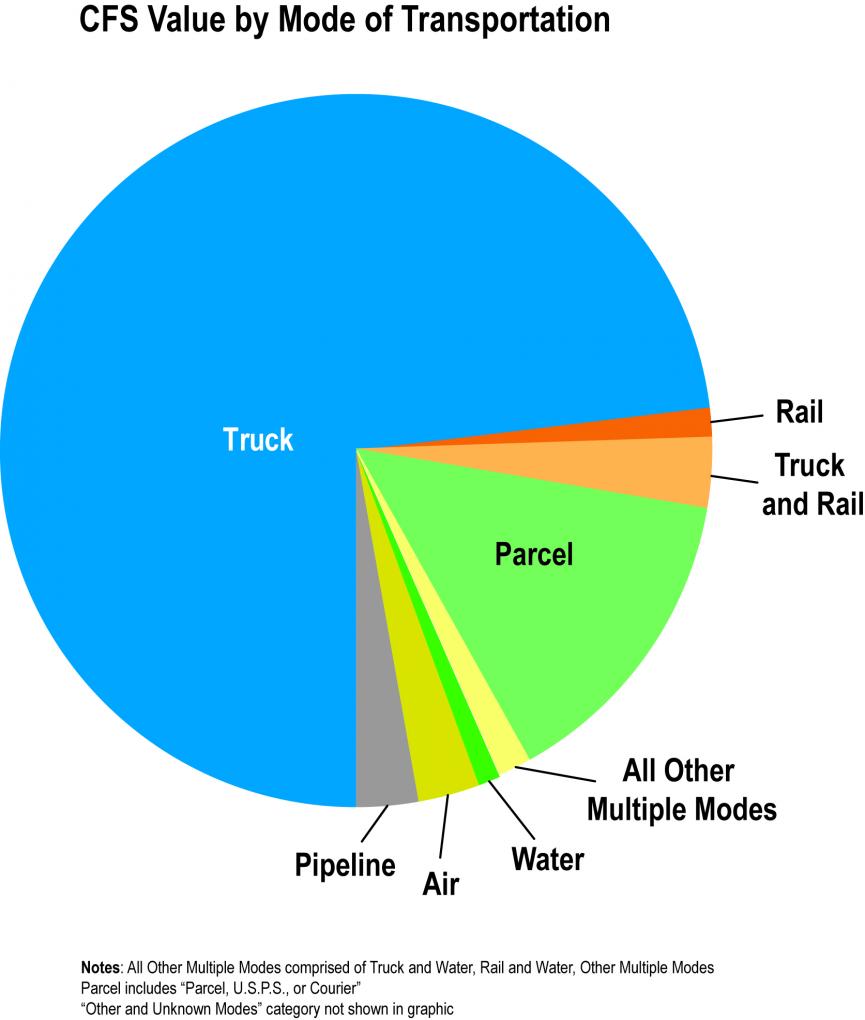
Truck shipments of manufactured goods, raw and refined products, and other goods represent more than 70 percent of both the value and the weight of freight as reported in the 2017 CFS. Trucks alone in 2017 moved 8.9 billion of tons valued at $10.5 trillion.


The Bureau of Transportation Statistics’ (BTS) survey, conducted every five years, is the principal source of data for the Department of Transportation’s Freight Analysis Framework (FAF). The CFS covers about three-fourths of all U.S. freight movements, excluding imports, shipments from farms, crude oil production, and a few smaller categories.
FAF, produced through a partnership between BTS and the Federal Highway Administration, integrates data from a variety of sources to create a comprehensive picture of freight movement among states and major metropolitan areas by all modes of transportation. Starting with data from the Commodity Flow Survey (CFS) and international trade data from the Census Bureau, FAF incorporates data from agriculture, extraction, utility, construction, service, and other sectors.
Preliminary CFS 2017 results:
Multiple modes
-
Parcel: Percent of CFS value: 14 percent
-
Amount moved: $2 trillion
-
-
Truck-rail: Percent of CFS value: 3 percent
-
Amount moved: $460 billion
-
Rail
- Second most used mode after truck by weight and ton-miles
- 1.2 billion tons and 843 billion ton-miles moved
- Ton-mile share rises to 47.5 percent of total CFS ton-miles by combining single-mode rail and multi-mode rail shipments that include truck and/or water.
Due to a methodological change in compiling the survey data, some shipments that would have been attributed to the single mode of rail in CFS 2012 and previous versions, were classified as as multiple mode in CFS 2017.
Shipment by industry
- Manufacturing
- Wholesale
Top commodities shipped
- Value
- Weight
- Ton-miles (weight and distance)
Coal: 563 billion ton-miles (18 percent of total ton-miles)
The CFS, is conducted as a partnership between BTS and the U.S. Census Bureau and is a component of the Economic Census. CFS 2017 is the sixth in the series that began in 1993. The CFS is a shipper survey of approximately 100,000 establishments from the industries of mining, manufacturing, wholesale trade, auxiliaries (i.e. warehouses and distribution centers), and select retail and service trade industries that ship commodities. The CFS provides a multimodal picture of national freight flows and represents the only publicly available source of data for the highway mode.
The preliminary tables are the first CFS 2017 products released. Final CFS data are scheduled to be released in December 2019. CFS data products and information on survey coverage, contents, and methods can be found on the BTS CFS webpage. FAF version 5 will be available following the release of final 2017 CFS data. Existing FAF Existing FAF information can be found on the BTS website.
