
COVID-19 Associated with Largest Year-Over-Year Decline of GDP Attributed to the Final Demand for Transportation
Transportation's Relative Contribution to GDP in 2020 Less than Any Year on Record; Private Investment in New Transportation Structures and Equipment Decreases Most among Transportation Demand Components
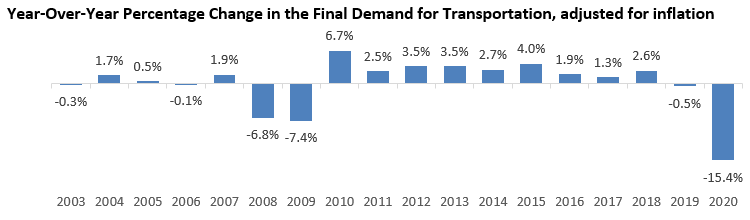
The final demand for transportation declined 15.4% ($295.2 billion) from 2019 to 2020 (adjusted for inflation) according to an analysis by the Bureau of Transportation Statistics of data from the Bureau of Economic Analysis. The drop during the first year of the COVID-19 pandemic was the largest year-over-year decrease since the start of the current data series in 2002. The second largest decline (7.4%) occurred in 2009 at the end of the Great Recession.
Source: U.S. Department of Commerce, Bureau of Economic Analysis, National Income and Product Accounts Tables, tables 1.1.4, 2.4.4, 3.11.4, 3.15.4, 4.2.4, 5.4.4, 5.5.4 and 5.7.4B (price deflators); 1.1.5, 2.4.5, 3.11.5, 3.15.5, 4.2.5, 5.4.5, 5.5.5 and 5.7.5B (current dollars); 1.1.6, 2.4.6, 3.11.6, 3.15.6, 4.2.6, 5.4.6, 5.5.6 and 5.7.6B (chained dollars), available at apps.bea.gov/iTable/index_nipa.cfm.
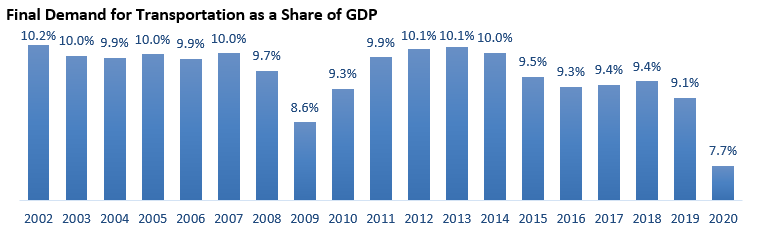
In 2020, the final demand for transportation goods and services was $1.6 trillion, or 7.7% of U.S. GDP – the smallest percentage contribution of transportation goods and services to GDP since the start of the current data series in 2002. The second smallest contribution (8.6%) occurred in 2009, also at the end of the Great Recession.
Source: U.S. Department of Commerce, Bureau of Economic Analysis, National Income and Product Accounts Tables, tables 1.1.4, 2.4.4, 3.11.4, 3.15.4, 4.2.4, 5.4.4, 5.5.4 and 5.7.4B (price deflators); 1.1.5, 2.4.5, 3.11.5, 3.15.5, 4.2.5, 5.4.5, 5.5.5 and 5.7.5B (current dollars); 1.1.6, 2.4.6, 3.11.6, 3.15.6, 4.2.6, 5.4.6, 5.5.6 and 5.7.6B (chained dollars), available at apps.bea.gov/iTable/index_nipa.cfm.
Private investment in new transportation structures and equipment like motor vehicles, aircraft, and ships — typically the fifth largest component of total transportation related final demand — fell 33.9% ($104.8 billion), a deeper drop than all other components of transportation related final demand.
Household spending on motor vehicles and parts increased 3.3% ($17.1 billion) (adjusted for inflation). Government investment in transportation infrastructure and purchases of transportation goods and services marginally increased (0.7% or $2.1 billion, adjusted for inflation). In contrast, household spending on transportation services (e.g. passenger air fare) decreased 25.8% ($117.3 billion) (adjusted for inflation).
Components of and their Contribution to 2020 Transportation Related Final Demand, and Year-Over-Year Percentage Change from 2019 to 2020
|
Components of transportation related final demand (largest to smallest) |
Inflation-adjusted 2019 (billion dollars) |
Inflation-adjusted 2020 (billion dollars) |
Contribution to total transportation related final demand in 2020 (percent) |
Year-over-year percentage change |
|
Motor vehicles and parts |
524.9 |
542.0 |
33.7 |
3.3 |
|
Government transportation-related purchases |
321.5 |
323.6 |
22.7 |
0.7 |
|
Transportation services |
454.4 |
337.1 |
22.6 |
-25.8 |
|
Motor vehicle fuels, lubricants, and fluids |
420.4 |
356.3 |
14.2 |
-15.2 |
|
Gross private domestic transportation |
309.6 |
204.8 |
13.8 |
-33.9 |
|
Net motor vehicle and other transportation insurance |
64.5 |
63.1 |
5.1 |
-2.3 |
|
Change in private inventories |
6.5 |
-22.5 |
-1.4 |
— |
|
Net exports of transportation-related goods and services |
-206.4 |
-205.7 |
-10.7 |
— |
Notes: Contribution to total transportation related final demand in 2020 calculated from current dollars (available at https://data.bts.gov/stories/s/pgc3-e7j9); year-over-year percentage change calculated from inflation-adjusted dollars. Change in private inventories (CIPI) measures the value of the change in the physical volume of the inventories—additions less withdrawals—businesses maintain to support their production and distribution activities. Inventory investment is one of the most volatile components of gross domestic product (GDP), giving it an important role in short run variations in GDP growth. More information on CIPI is available at https://www.bea.gov/resources/methodologies/nipa-handbook/pdf/chapter-07.pdf
More updated data is available on our Final Demand Attributed to Transportation page. Data on other economic topics are available on our Transportation Economic Trends pages.