
December 2012 U.S. Surface Transportation Trade with Canada and Mexico Totaled $71.9 Billion
Figure 1: North American Surface Transportation Trade: January 2004 - December 2012
(billions of current U.S. dollars)
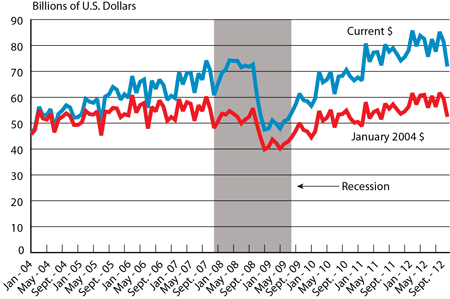
SOURCE: BTS TransBorder Freight Data, https://data.bts.gov/stories/s/TransBorder-Freight-Data/myhq-rm6q/
Trade using surface transportation between the United States and its North American Free Trade Agreement (NAFTA) partners, Canada and Mexico, decreased 3.2 percent in December 2012 compared to December 2011, totaling $71.9 billion, according to the Bureau of Transportation Statistics (BTS) of the U.S. Department of Transportation (Figure 1 and Table 1).
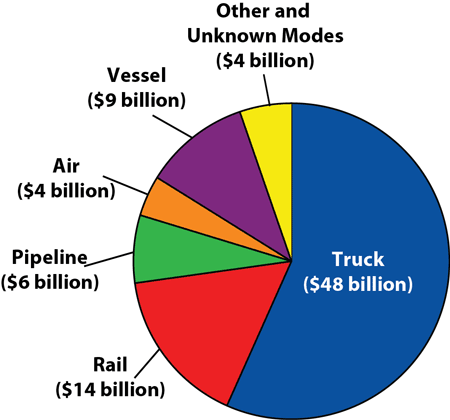
BTS, a part of the Department’s Research and Innovative Technology Administration, reported that in December 2012, $48 billion of U.S. trade with Canada and Mexico moved by truck, $14 billion moved by rail, and $6 billion moved by pipeline (Figure 2). Surface transportation includes freight movements by truck, rail, pipeline, mail, other modes of transport, and goods moving into Foreign Trade Zones. Surface transportation trade with Canada and Mexico accounted for 17 percent of total U.S. foreign trade in December 2012.
Figure 2: North American Freight by Mode, December 2012
(current U.S. dollars)
| Mode | Total Trade Value | Percent |
| All Modes | 84,694,670,516 | 100.0 |
| Truck | 48,035,363,100 | 56.7 |
| Rail | 13,702,684,022 | 16.2 |
| Pipeline | 5,707,681,264 | 6.7 |
| Air | 3,687,714,875 | 4.4 |
| Vessel | 9,120,958,477 | 10.8 |
| Other and Unknown Modes | 4,440,268,778 | 5.2 |
SOURCE: BTS TransBorder Freight Data, https://data.bts.gov/stories/s/TransBorder-Freight-Data/myhq-rm6q/
U.S.-Canada surface trade was $42.1 billion in December 2012, while U.S.-Mexico surface trade was $29.8 billion. For trade statistics by mode, see Table 3 for Canada and Table 5 for Mexico.
In December, Michigan led all states in surface trade with Canada, at $5.6 billion (Table 4). The top commodity category transported between the U.S. and Canada by surface modes of transportation in December was vehicles and parts, valued at $7.8 billion (Table 7).
Texas continued to lead all states in surface trade with Mexico at $10.3 billion (Table 6). The top commodity category transported between the U.S. and Mexico by surface modes of transportation in December was electrical machinery with $6.3 billion in trade (Table 8).
For more information, see Transborder Press Releases for previous press releases and summary tables. See TransBorder Freight Data for data from previous months, and individual state data. BTS has scheduled the release of January TransBorder numbers for March 27. Additionally, the North American Surface Freight Data 2012 Annual Report will be released on March 21.
Table 1. Value of Monthly U.S. Surface Transportation Trade with Canada and Mexico
(millions of current U.S. dollars)
| Month | 2010 | 2011 | 2012 | Percent Change 2010-2011 | Percent Change 2011-2012 |
|---|---|---|---|---|---|
| January | 56,697 | 67,734 | 75,534 | 19.5 | 11.5 |
| February | 59,492 | 66,534 | 78,135 | 11.8 | 17.4 |
| March | 69,943 | 80,822 | 85,827 | 15.6 | 6.2 |
| April | 65,831 | 73,767 | 79,784 | 12.1 | 8.2 |
| May | 66,805 | 77,318 | 83,770 | 15.7 | 8.3 |
| June | 69,859 | 77,521 | 82,601 | 11.0 | 6.6 |
| July | 61,260 | 72,363 | 75,694 | 18.1 | 4.6 |
| August | 67,964 | 80,406 | 82,480 | 18.3 | 2.6 |
| September | 68,324 | 77,725 | 77,680 | 13.8 | -0.1 |
| October | 70,565 | 79,040 | 85,290 | 12.0 | 7.9 |
| November | 68,060 | 76,672 | 81,453 | 12.7 | 6.2 |
| December | 66,530 | 74,230 | 71,886 | 11.6 | -3.2 |
| Annual | 791,329 | 904,133 | 960,135 | 14.3 | 6.2 |
Source: BTS TransBorder Freight Data, https://data.bts.gov/stories/s/TransBorder-Freight-Data/myhq-rm6q/
Note: Numbers may not add to totals due to rounding. Percent change based on numbers prior to rounding.
Table 2. December 2012 U.S. Trade with Canada and Mexico by Mode
(millions of current U.S. dollars)
| Mode | December 2011 | November 2012 | December 2012 | Percent Change November 2012 - December 2012 | Percent Change December 2011 - 2012 | |
|---|---|---|---|---|---|---|
| All Surface Modes | Imports | 40,469 | 43,616 | 38,884 | -10.9 | -3.9 |
| Exports | 33,761 | 37,837 | 33,002 | -12.8 | -2.2 | |
| Total | 74,230 | 81,453 | 71,886 | -11.7 | -3.2 | |
| Truck | Imports | 23,999 | 27,235 | 23,239 | -14.7 | -3.2 |
| Exports | 26,126 | 28,945 | 24,796 | -14.3 | -5.1 | |
| Rail | Imports | 8,689 | 9,621 | 9,006 | -6.4 | 3.6 |
| Exports | 4,463 | 5,236 | 4,697 | -10.3 | 5.2 | |
| Pipeline | Imports | 6,398 | 5,160 | 5,101 | -1.2 | -20.3 |
| Exports | 583 | 772 | 607 | -21.4 | 4.0 |
Source: BTS TransBorder Freight Data, https://data.bts.gov/stories/s/TransBorder-Freight-Data/myhq-rm6q/
Notes: Numbers may not add to totals due to rounding. Percent change based on numbers prior to rounding. The value of trade for all surface modes is not equal to the sum of truck, rail and pipeline modes, it also includes shipments made by mail, foreign trade zones, other and unknown modes of transportation. For additional detail refer to the “Data Fields” Section of the TransBorder web page: http://www.bts.gov/programs/international/transborder/TBDR_DataFields.h….
Table 3. December 2012 U.S. Trade with Canada by Mode
(millions of current U.S. dollars)
| Mode | December 2011 | November 2012 | December 2012 | Percent Change November 2012 - December 2012 | Percent Change December 2011 - 2012 | |
|---|---|---|---|---|---|---|
| All Surface Modes | Imports | 23,819 | 24,364 | 22,377 | -8.2 | -6.1 |
| Exports | 20,404 | 22,306 | 19,750 | -11.5 | -3.2 | |
| Total | 44,223 | 46,670 | 42,127 | -9.7 | -4.7 | |
| Truck | Imports | 10,541 | 11,738 | 10,130 | -13.7 | -3.9 |
| Exports | 15,702 | 17,063 | 14,803 | -13.2 | -5.7 | |
| Rail | Imports | 5,805 | 6,242 | 5,903 | -5.4 | 1.7 |
| Exports | 2,355 | 2,569 | 2,664 | 3.7 | 13.1 | |
| Pipeline | Imports | 6,375 | 5,141 | 5,082 | -1.1 | -20.3 |
| Exports | 348 | 552 | 343 | -37.9 | -1.4 |
Source: BTS TransBorder Freight Data, https://data.bts.gov/stories/s/TransBorder-Freight-Data/myhq-rm6q/
Notes: Numbers may not add to totals due to rounding. Percent change based on numbers prior to rounding. The value of trade for all surface modes is not equal to the sum of truck, rail and pipeline modes, it also includes shipments made by mail, foreign trade zones, other and unknown modes of transportation. For additional detail refer to the “Data Fields” Section of the TransBorder web page: http://www.bts.gov/programs/international/transborder/TBDR_DataFields.h….
Table 4. Top 10 States Trading with Canada by All Surface Modes of Transportation
Ranked by December 2012 Surface Trade Value
(millions of current U.S. dollars)
| State | December 2011 | December 2012 | Percent Change December 2011-2012 | ||
|---|---|---|---|---|---|
| Value | Rank | Value | Rank | ||
| Michigan | 5,592 | 1 | 5,599 | 1 | 0.1 |
| Illinois | 4,756 | 2 | 4,056 | 2 | -14.7 |
| California | 2,844 | 3 | 2,754 | 3 | -3.2 |
| Ohio | 2,626 | 4 | 2,525 | 4 | -3.9 |
| Texas | 2,518 | 5 | 2,487 | 5 | -1.2 |
| New York | 2,336 | 6 | 2,177 | 6 | -6.8 |
| Pennsylvania | 1,687 | 7 | 1,597 | 7 | -5.3 |
| Washington | 1,635 | 8 | 1,471 | 8 | -10.0 |
| Indiana | 1,425 | 10 | 1,386 | 9 | -2.8 |
| Minnesota | 1,617 | 9 | 1,339 | 10 | -17.2 |
Source: BTS TransBorder Freight Data, https://data.bts.gov/stories/s/TransBorder-Freight-Data/myhq-rm6q/
Note: Numbers may not add to totals due to rounding. Percent change based on numbers prior to rounding.
Table 5. December 2012 U.S. Trade with Mexico by Mode
(millions of current U.S. dollars)
| Mode | December 2011 | November 2012 | December 2012 | Percent Change November 2012 - December 2012 | Percent Change December 2011 - 2012 | |
|---|---|---|---|---|---|---|
| All Surface Modes | Imports | 16,649 | 19,252 | 16,507 | -14.3 | -0.9 |
| Exports | 13,357 | 15,531 | 13,252 | -14.7 | -0.8 | |
| Total | 30,007 | 34,783 | 29,759 | -14.4 | -0.8 | |
| Truck | Imports | 13,458 | 15,496 | 13,110 | -15.4 | -2.6 |
| Exports | 10,424 | 11,882 | 9,993 | -15.9 | -4.1 | |
| Rail | Imports | 2,884 | 3,379 | 3,102 | -8.2 | 7.6 |
| Exports | 2,108 | 2,667 | 2,033 | -23.8 | -3.6 | |
| Pipeline | Imports | 22 | 19 | 19 | -3.4 | -16.3 |
| Exports | 236 | 220 | 264 | 19.8 | 11.9 |
Source: BTS TransBorder Freight Data, https://data.bts.gov/stories/s/TransBorder-Freight-Data/myhq-rm6q/
Notes: Numbers may not add to totals due to rounding. Percent change based on numbers prior to rounding. The value of trade for all surface modes is not equal to the sum of truck, rail and pipeline modes, it also includes shipments made by mail, foreign trade zones, other and unknown modes of transportation. For additional detail refer to the “Data Fields” Section of the TransBorder web page: http://www.bts.gov/programs/international/transborder/TBDR_DataFields.h….
Table 6. Top 10 States Trading with Mexico by All Surface Modes of Transportation
Ranked by December 2012 Surface Trade Value
(millions of current U.S. dollars)
| State | December 2011 | December 2012 | Percent Change December 2011-2012 | ||
|---|---|---|---|---|---|
| Value | Rank | Value | Rank | ||
| Texas | 10,282 | 1 | 10,263 | 1 | -0.2 |
| California | 4,459 | 2 | 4,242 | 2 | -4.9 |
| Michigan | 3,649 | 3 | 3,795 | 3 | 4.0 |
| Arizona | 994 | 5 | 1,002 | 4 | 0.9 |
| Illinois | 1,021 | 4 | 979 | 5 | -4.1 |
| Ohio | 746 | 6 | 783 | 6 | 5.1 |
| Tennessee | 627 | 7 | 629 | 7 | 0.3 |
| Georgia | 387 | 12 | 531 | 8 | 37.3 |
| Indiana | 509 | 9 | 479 | 9 | -5.8 |
| North Carolina | 560 | 8 | 475 | 10 | -15.2 |
Source: BTS TransBorder Freight Data, https://data.bts.gov/stories/s/TransBorder-Freight-Data/myhq-rm6q/
Note: Numbers may not add to totals due to rounding. Percent change based on numbers prior to rounding.
Table 7. Top Five Commodities Transported between the U.S. and Canada by All Surface Modes of Transportation, December 2012
(millions of current U.S. dollars)
| Commodities | Exports | Imports | Total |
|---|---|---|---|
| Vehicles Other than Railway | 3,508 | 4,337 | 7,845 |
| Oil and Gas | 889 | 6,527 | 7,416 |
| Computer-Related Machinery and Parts | 3,291 | 1,442 | 4,732 |
| Electrical Machinery; Equipment and Parts | 1,872 | 486 | 2,358 |
| Plastics | 854 | 743 | 1,598 |
Source: BTS TransBorder Freight Data, https://data.bts.gov/stories/s/TransBorder-Freight-Data/myhq-rm6q/
Note: Numbers may not add to totals due to rounding.
Table 8. Top Five Commodities Transported between the U.S. and Mexico by All Surface Modes of Transportation, December 2012
(millions of current U.S. dollars)
| Commodities | Exports | Imports | Total |
|---|---|---|---|
| Electrical Machinery; Equipment and Parts | 2,220 | 4,075 | 6,295 |
| Vehicles Other than Railway | 1,465 | 4,035 | 5,500 |
| Computer-Related Machinery and Parts | 2,428 | 2,707 | 5,135 |
| Plastics | 1,018 | 249 | 1,266 |
| Measuring and Testing Instruments | 371 | 679 | 1,049 |
Source: BTS TransBorder Freight Data, https://data.bts.gov/stories/s/TransBorder-Freight-Data/myhq-rm6q/
Note: Numbers may not add to totals due to rounding.