
Docked Bikeshare Trips – July 2025
Today, the Bureau of Transportation Statistics (BTS) released docked bikeshare trips for July 2025.
From July 2024 to July 2025, docked bikeshare trips starting and ending at a docking station on seven of the largest systems grew 4.2%.
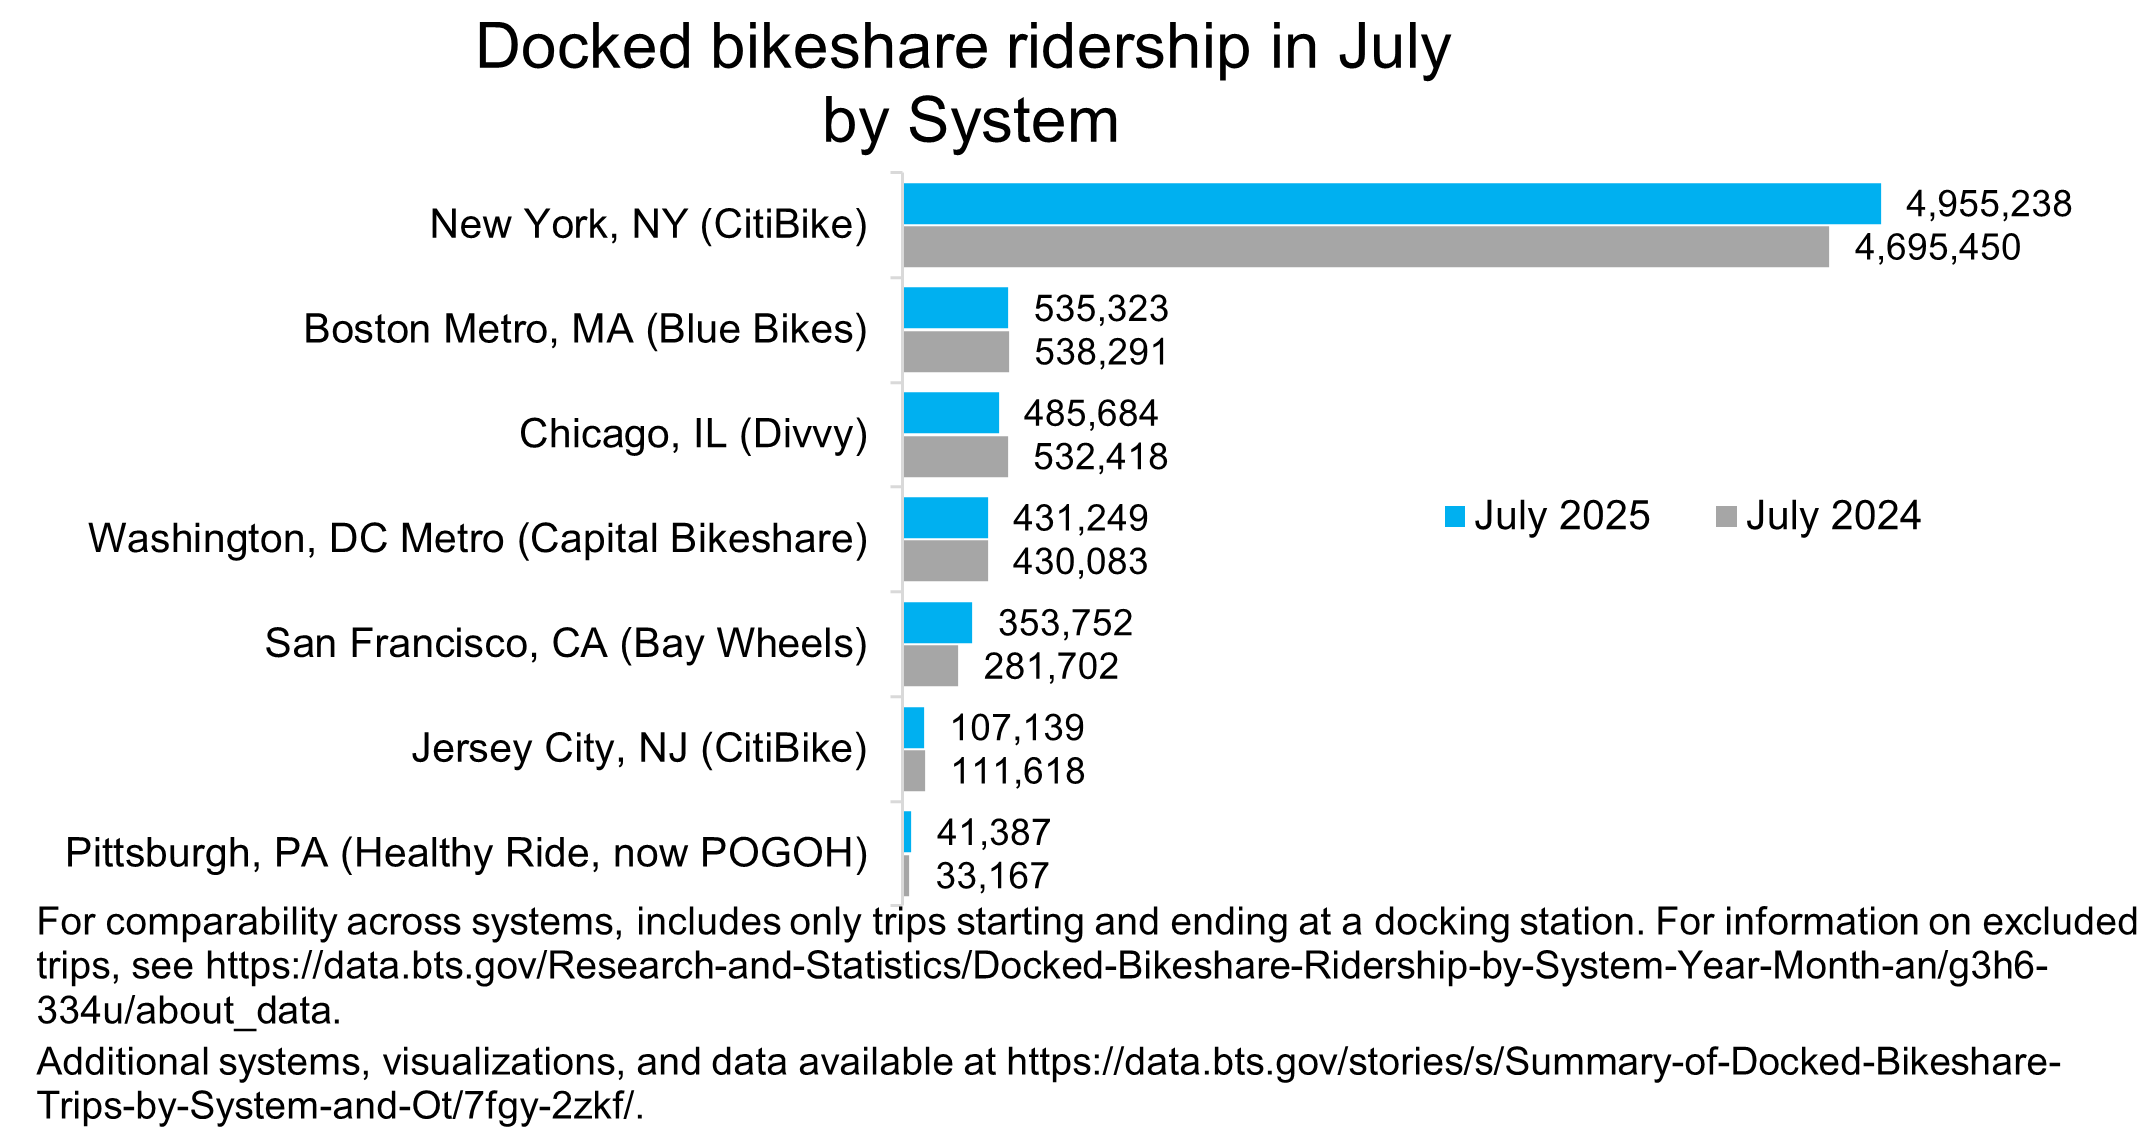
By area served and system, the number of docked bikeshare trips in July 2025 and the percentage change from July 2024 on six of the largest systems with data:
- New York, NY (CitiBike): 4,955,238 (up 5.5%)
- Boston Metro, MA (Blue Bikes): 535,323 (down 0.6%)
- Chicago, IL (Divvy): 485,684 (down 8.8%)
- Washington, DC Metro (Capital Bikeshare): 431,249 (up 0.3%)
- San Francisco, CA (Bay Wheels): 353,752 (up 25.6%)
- Jersey City, NJ (CitiBike): 107,139 (down 4.0%)
- Pittsburgh, PA (Healthy Ride, now POGOH): 41,387 (up 24.8%)
For additional information, data for additional systems, and interactive charts, please visit BTS’ Bikeshare and E-scooters. Data available for Columbus, OH (CoGo) through February 2025; Los Angeles, CA (Metro Bike Share) through June 2025; and Philadelphia, PA (Indego) through June 2025.
To receive updates from BTS directly to your email, please consider subscribing to our GovDelivery service.