
Employees at U.S. Scheduled Passenger Airlines Month of May, 1990-2021
(Full-Time Equivalents)
Figure
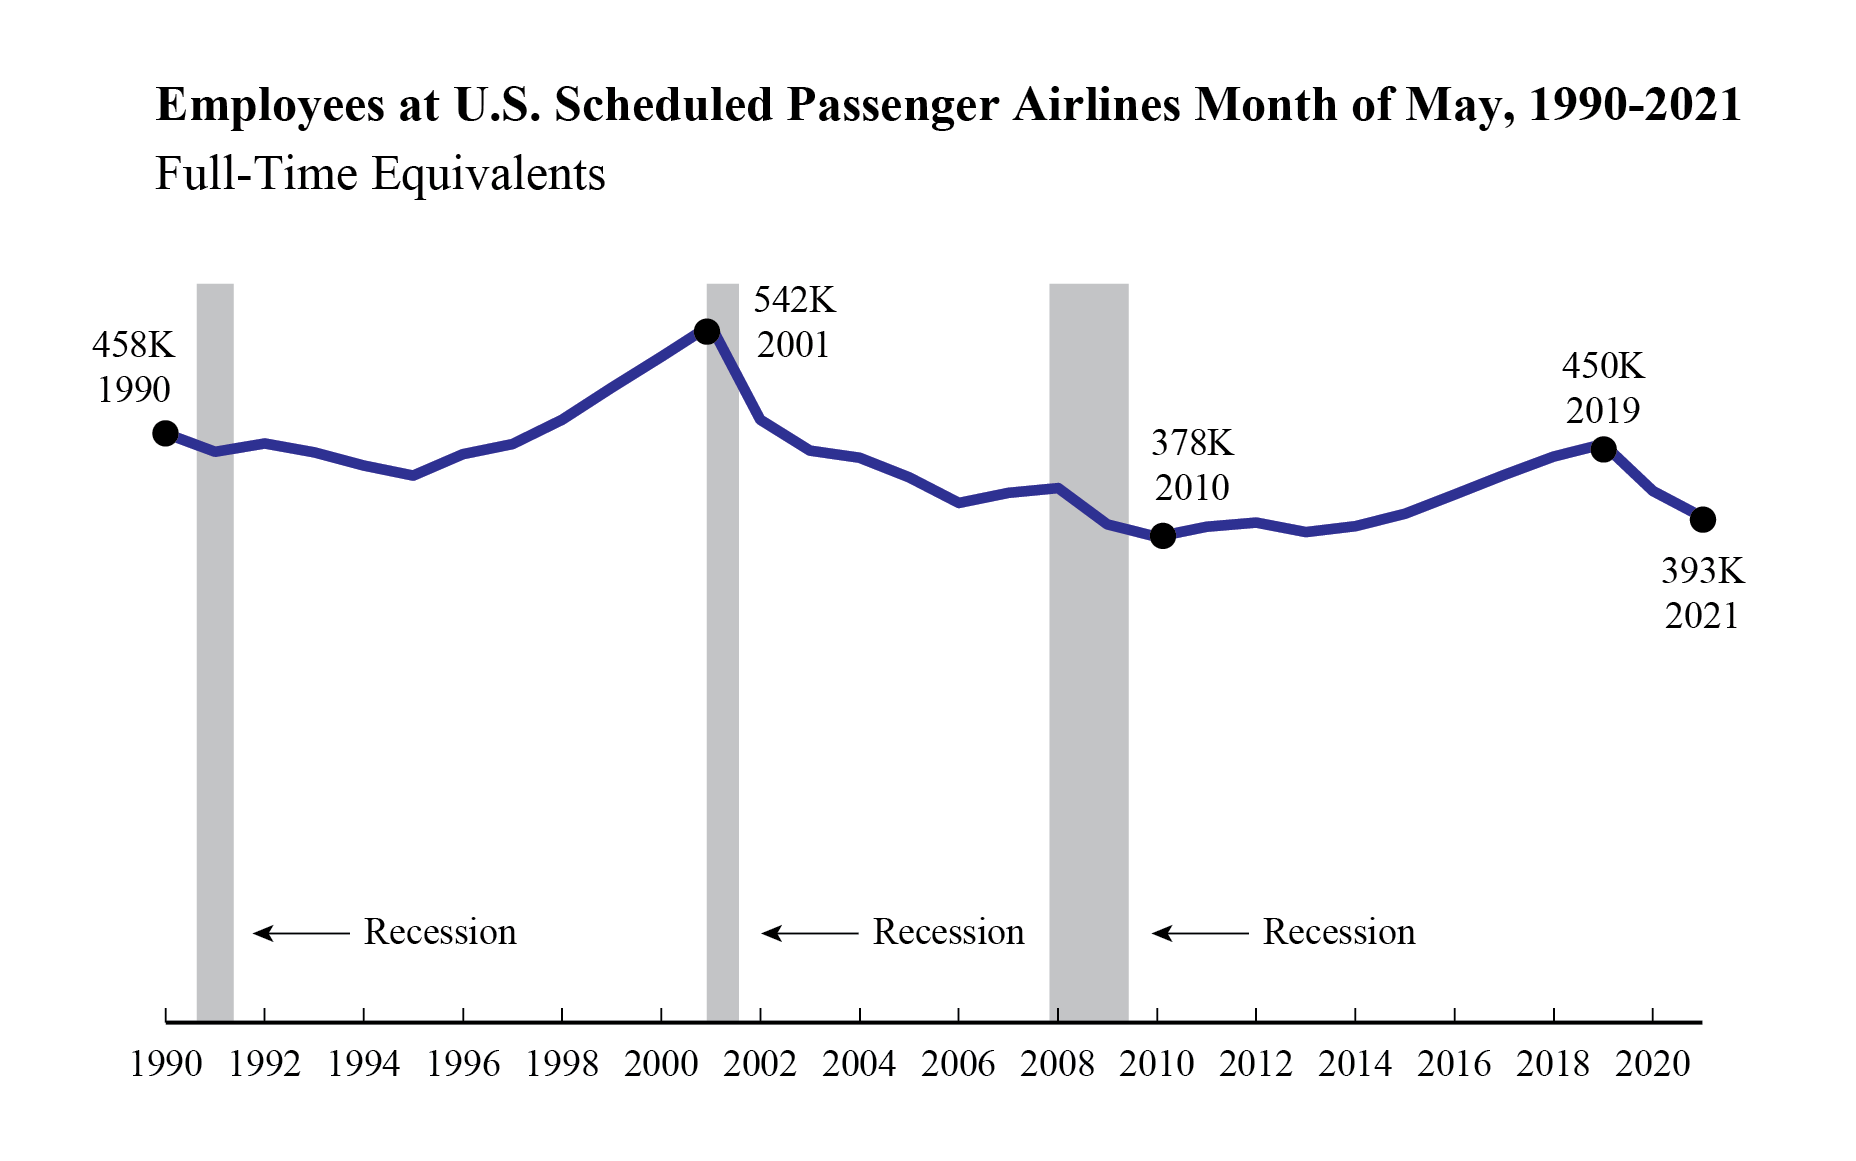
Dataset Table:
| May FTEs in thousands (000) | |
|---|---|
| 1990 | 457.8 |
| 1991 | 443.6 |
| 1992 | 450.2 |
| 1993 | 443.3 |
| 1994 | 433.2 |
| 1995 | 425.3 |
| 1996 | 441.7 |
| 1997 | 449.9 |
| 1998 | 468.7 |
| 1999 | 493.8 |
| 2000 | 517.5 |
| 2001 | 542.1 |
| 2002 | 468.5 |
| 2003 | 444.4 |
| 2004 | 438.8 |
| 2005 | 423.7 |
| 2006 | 403.7 |
| 2007 | 411.9 |
| 2008 | 415.5 |
| 2009 | 387.4 |
| 2010 | 377.5 |
| 2011 | 385.3 |
| 2012 | 388.5 |
| 2013 | 381.4 |
| 2014 | 385.6 |
| 2015 | 395.6 |
| 2016 | 410.3 |
| 2017 | 425.7 |
| 2018 | 439.7 |
| 2019 | 449.6 |
| 2020 | 413.2 |
| 2021 | 393.0 |
Notes:
FTE calculations count two part-time employees as one full-time employee.
Source:
Bureau of Transportation Statistics