
Figure 1. U.S. Average Domestic Annual Fares, 1995-2020
Figure
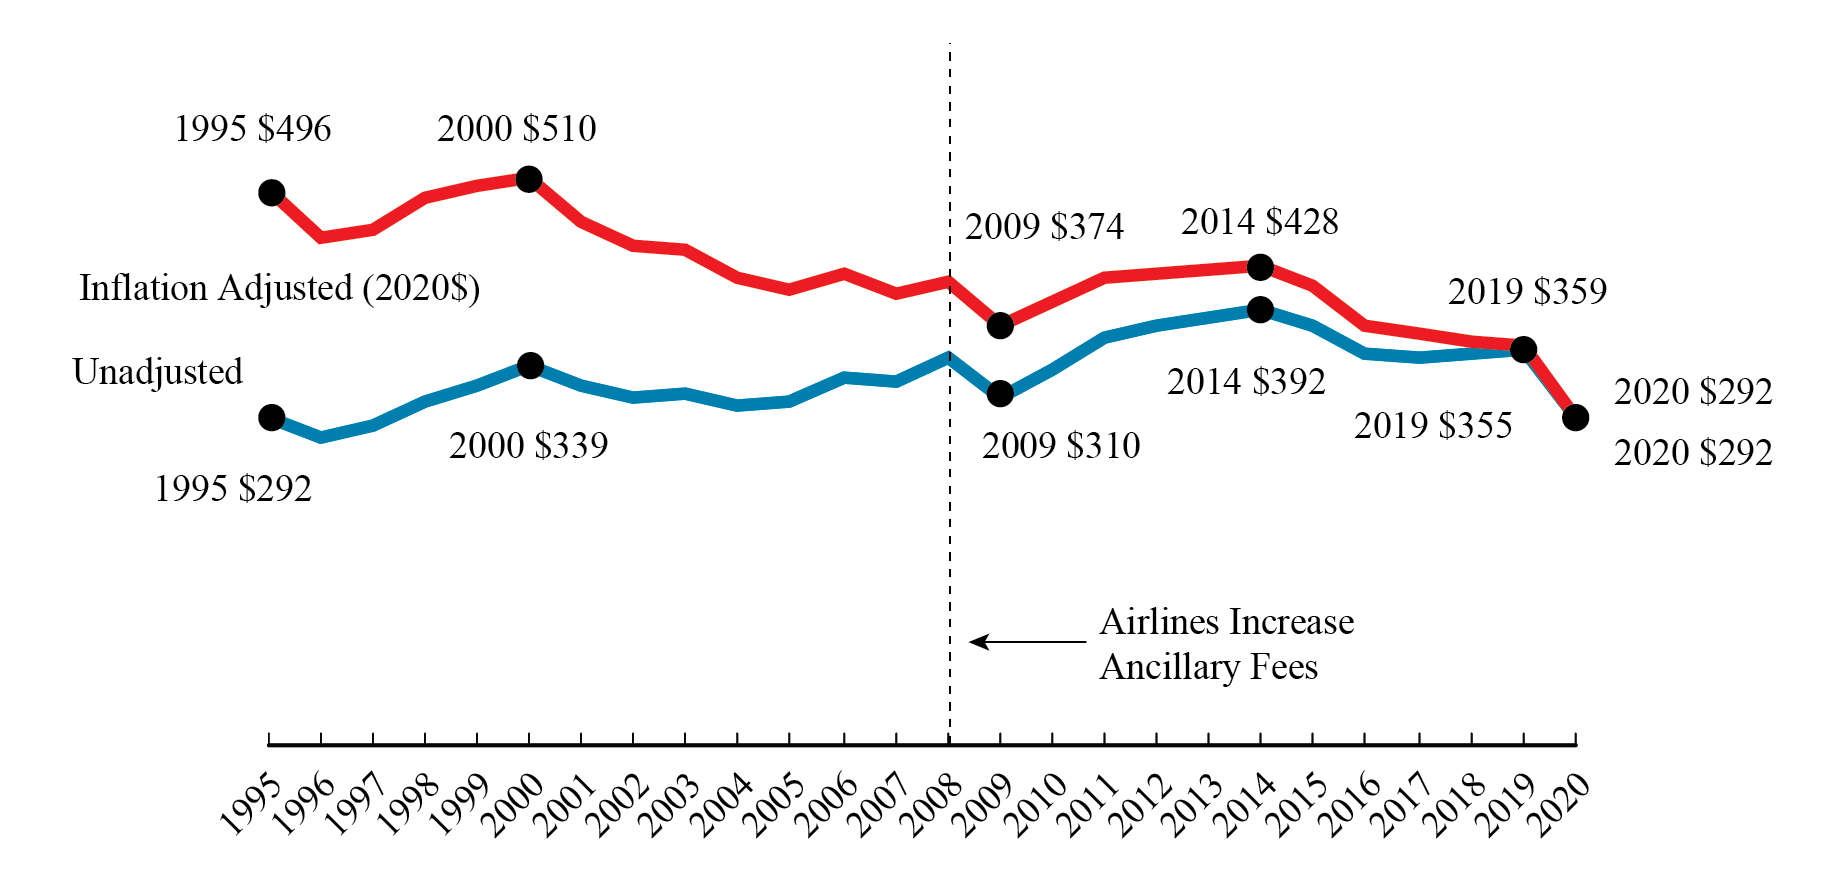
Dataset Table:
| Year | Unadjusted Fares (current dollars) | Inflation-Adjusted (2020 $) |
|---|---|---|
| 1995 | 292 | 496 |
| 1996 | 277 | 456 |
| 1997 | 287 | 463 |
| 1998 | 309 | 491 |
| 1999 | 324 | 503 |
| 2000 | 339 | 510 |
| 2001 | 321 | 469 |
| 2002 | 312 | 449 |
| 2003 | 315 | 444 |
| 2004 | 305 | 418 |
| 2005 | 307 | 407 |
| 2006 | 329 | 422 |
| 2007 | 325 | 406 |
| 2008 | 346 | 416 |
| 2009 | 310 | 374 |
| 2010 | 336 | 399 |
| 2011 | 364 | 419 |
| 2012 | 375 | 422 |
| 2013 | 382 | 424 |
| 2014 | 392 | 428 |
| 2015 | 377 | 412 |
| 2016 | 349 | 377 |
| 2017 | 348 | 367 |
| 2018 | 350 | 360 |
| 2019 | 355 | 359 |
| 2020 | 292 | 292 |
Source:
Bureau of Transportation Statistics, Origin and Destination Survey