2019 Traffic Data for U.S. Airlines and Foreign Airlines U.S. Flights - Final, Full-Year

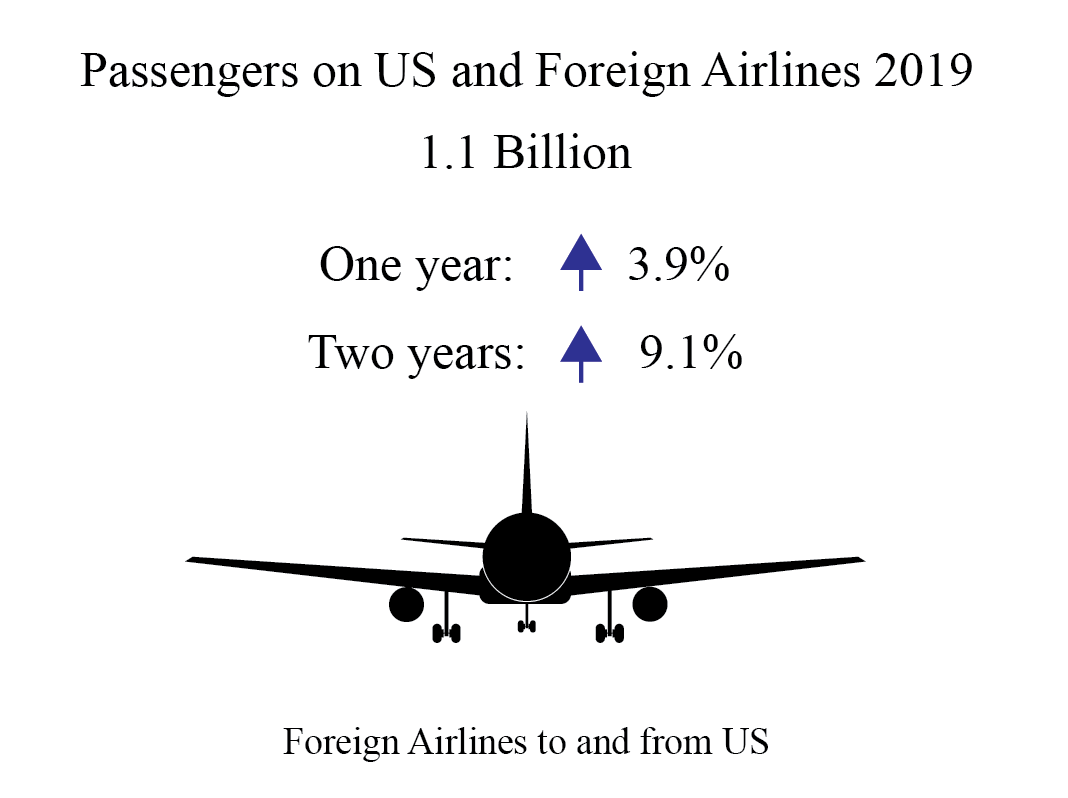
U.S. airlines and foreign airlines serving the U.S. carried an all-time high of 1.1 billion systemwide (domestic and international) scheduled service passengers in 2019, 3.9% more than the previous annual record high of 1.0 billion reached in 2018.
- Systemwide: 1,053 million passengers, up 3.9% from 2018 (1,014M)
- Domestic: 811 million passengers, up 4.3% from 2018 (778M)
- International: 241 million passengers, up 2.4% from 2018 (236M)
Systemwide passengers are those on all U.S. scheduled airline flights (domestic & international) and foreign airline flights to and from the U.S. Domestic passengers are those on flights from one U.S. airport to another U.S. airport. International passengers are those on flights between a U.S. airport and a foreign airport.
U.S. airlines passengers in 2019
- Systemwide: 927 million, up 4.2% from 2018 (889M)
- Domestic: 811 million, up 4.3% from 2018 (778M)
- International* (to and from the U.S.): 115 million, up 3.8% from 2018 (111M)
*Includes flights from one foreign point to another foreign point (296,911 passengers in 2019)
Foreign airlines passengers in 2019
- International to and from the U.S.: 126 million, up 1.2% from 2018 (125M)
This annual release includes data on U.S. airlines scheduled domestic and international service, including from one foreign point to another foreign point (296,911 passengers), and foreign carrier scheduled service to and from the U.S. BTS monthly air traffic releases include data on U.S. carrier scheduled service only.
Airlines with Most Passengers in 2019
- Systemwide: Southwest Airlines (164M)
- Domestic: Southwest (158M)
- International: American Airlines (30M)
- Foreign airline to and from the U.S.: British Airways (7M)
U.S. Airports with Most Passenger Boardings in 2019
- Systemwide: Atlanta Hartsfield-Jackson International (53M)
- Domestic: Atlanta Hartsfield-Jackson International (47M)
- International: New York John F. Kennedy (17M)
| Destination | |||||
| Domestic | Foreign | ||||
| Domestic | U.S Airlines | 818.4 | U.S. airlines | 57.6 | |
| Origin | Foreign airlines | N/A | Foreign airlines | 63.6 | |
| Foreign | U.S airlines | 57.4 | U.S airlines | 0.5 | |
| Foreign airlines | 64.3 | Foreign airlines | N/A | ||
Source: Bureau of Transportation Statistics, T-100 Market (All Carriers)
* Foreign carriers do not report to the Bureau of Transportation Statistics on flights without a U.S. origin or destination
Load Factor and Capacity (load factor measures the use of capacity)
Systemwide (Domestic + International)
- Revenue Passenger-Miles (RPMs), up 3.4% from 2018
- Available Seat-Miles (ASMs), up 2.4%
- Load Factor, up 0.8 points from 83.0 to 83.8
Domestic (to and from U.S. airports)
- RPMs, up 4.4%
- ASMs, up 3.7%
- Load Factor, up 0.6 points from 84.5 to 85.1
International (to and from the U.S.)
- RPMs, up 2.5%
- ASMs, up 1.3%
- Load Factor, up 1.0 points from 81.7 to 82.7
For annual airline and airport statistics, see the accompanying tables on the BTS website. Tables 1 through 4 provide combined domestic and international travel statistics, Tables 5 through 8 provide domestic travel statistics and Tables 9 through 12 provide international travel statistics.
Reporting Notes
Data are compiled from monthly reports filed with BTS by commercial U.S. and foreign airlines detailing operations, passenger traffic and freight traffic. This release includes data received by BTS from 207 U.S. and foreign airlines as of March 3 for scheduled civilian operations.
See the BTS Airlines and Airports page for additional scheduled service numbers through December for U.S. airlines. International data by origin and destination is available through September.
Complete international data for the full year 2019 will be released on June 11.
None of the data are from samples so measures of statistical significance do not apply. Data in this press release are not seasonally adjusted.
