
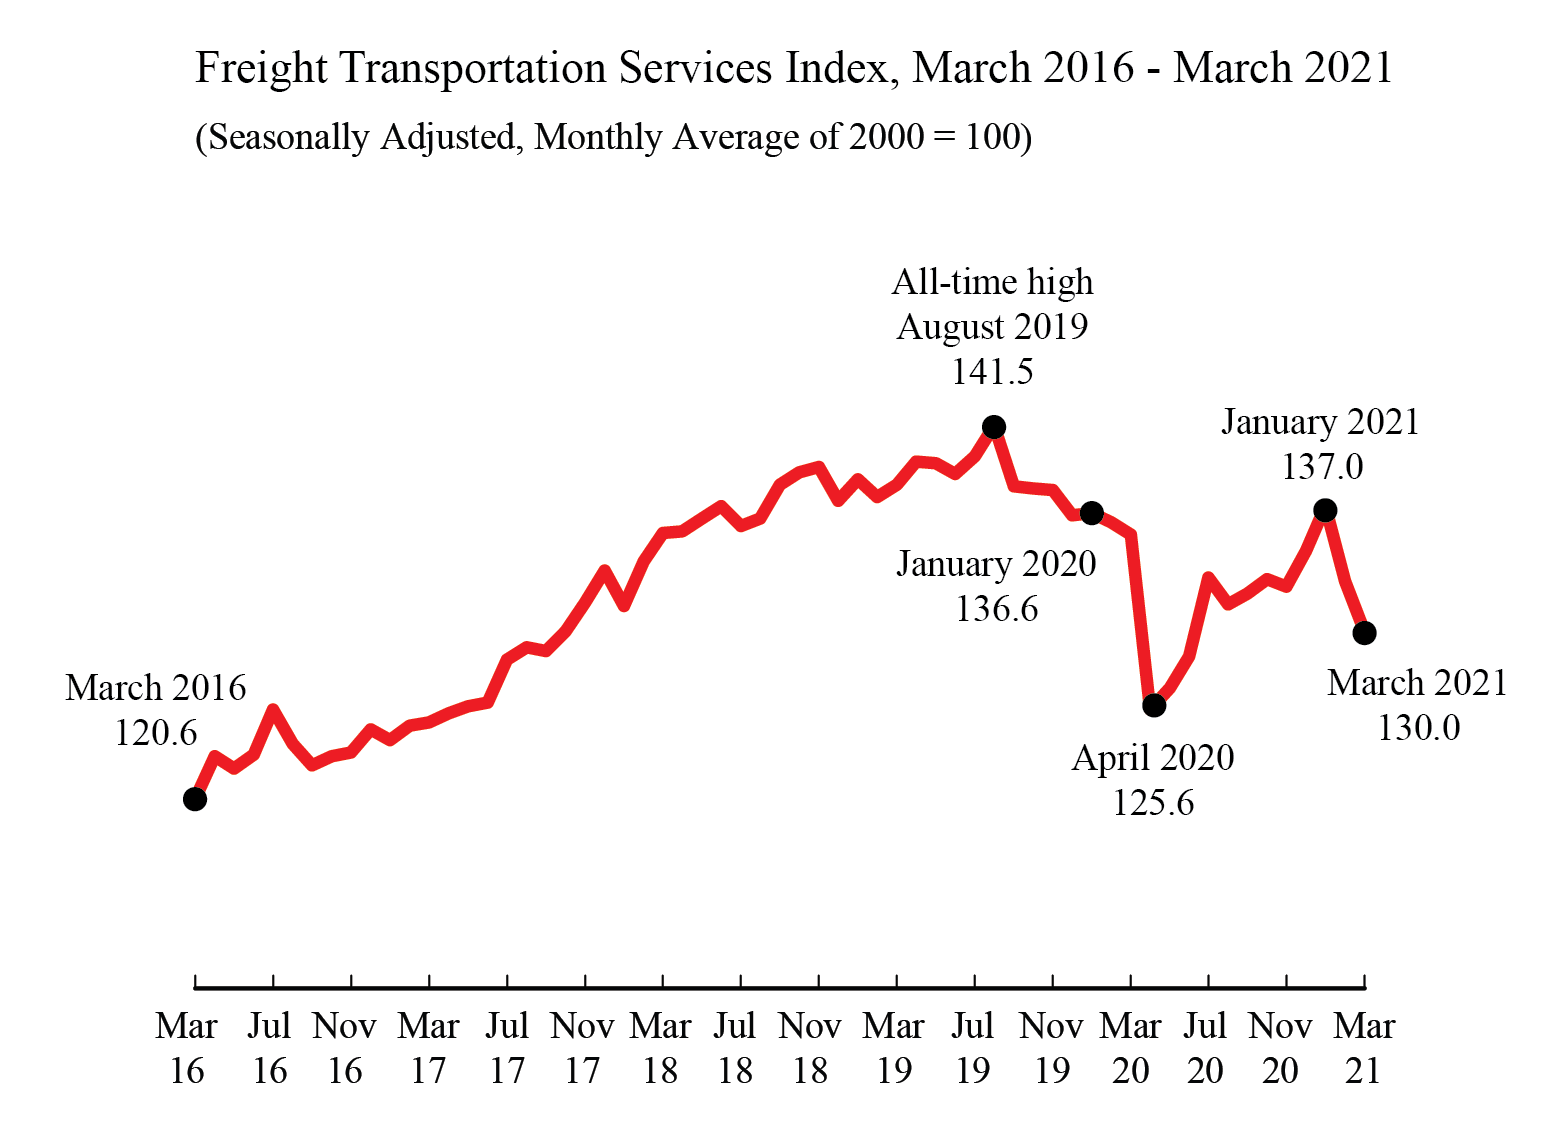
Freight Transportation Services Index, March 2016 - March 2021
(Seasonally Adjusted, Monthly Average of 2000 = 100)
Figure
Dataset Table:
| Month | Freight TSI |
|---|---|
| Mar-16 | 120.6 |
| Apr-16 | 123.0 |
| May-16 | 122.3 |
| Jun-16 | 123.1 |
| Jul-16 | 125.6 |
| Aug-16 | 123.7 |
| Sep-16 | 122.5 |
| Oct-16 | 123.0 |
| Nov-16 | 123.2 |
| Dec-16 | 124.5 |
| Jan-17 | 123.9 |
| Feb-17 | 124.7 |
| Mar-17 | 124.9 |
| Apr-17 | 125.4 |
| May-17 | 125.8 |
| Jun-17 | 126.0 |
| Jul-17 | 128.4 |
| Aug-17 | 129.1 |
| Sep-17 | 128.9 |
| Oct-17 | 130.0 |
| Nov-17 | 131.6 |
| Dec-17 | 133.4 |
| Jan-18 | 131.4 |
| Feb-18 | 133.9 |
| Mar-18 | 135.5 |
| Apr-18 | 135.6 |
| May-18 | 136.3 |
| Jun-18 | 137.0 |
| Jul-18 | 135.9 |
| Aug-18 | 136.3 |
| Sep-18 | 138.2 |
| Oct-18 | 138.9 |
| Nov-18 | 139.2 |
| Dec-18 | 137.3 |
| Jan-19 | 138.5 |
| Feb-19 | 137.5 |
| Mar-19 | 138.2 |
| Apr-19 | 139.5 |
| May-19 | 139.4 |
| Jun-19 | 138.8 |
| Jul-19 | 139.8 |
| Aug-19 | 141.5 |
| Sep-19 | 138.1 |
| Oct-19 | 138.0 |
| Nov-19 | 137.9 |
| Dec-19 | 136.5 |
| Jan-20 | 136.6 |
| Feb-20 | 136.1 |
| Mar-20 | 135.4 |
| Apr-20 | 125.6 |
| May-20 | 126.8 |
| Jun-20 | 128.6 |
| Jul-20 | 133.0 |
| Aug-20 | 131.5 |
| Sep-20 | 132.1 |
| Oct-20 | 132.9 |
| Nov-20 | 132.5 |
| Dec-20 | 134.5 |
| Jan-21 | 137.0 |
| Feb-21 | 132.8 |
| Mar-21 | 130.0 |
Source:
Bureau of Transportation Statistics