
May 2022 U.S. Airline Traffic Data
BTS 35-22
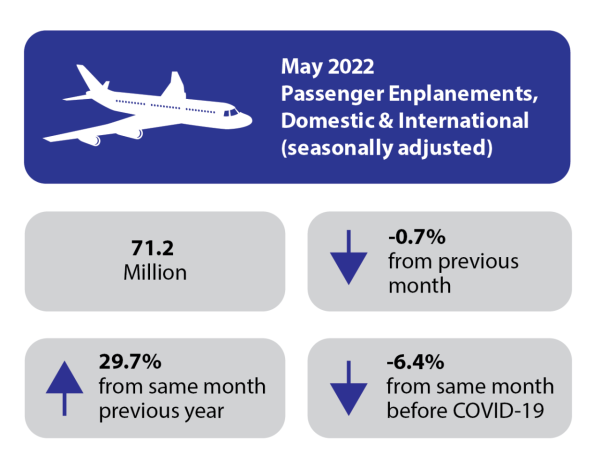
U.S. airlines carried 71.2 million systemwide (domestic and international) scheduled service passengers in May 2022, seasonally adjusted, according to the Bureau of Transportation Statistics’ (BTS), down 0.7% from April.
BTS reported 62.8 million domestic passengers and 8.3 million international passengers on flights by U.S. airlines in May.
U.S. airline traffic reports are filed monthly with BTS. See the tables that accompany this release on the BTS website for summary data since 2016 (Tables 1-24) and complete data since 2000.
Two measures of U.S. airlines passenger enplanements
May seasonally adjusted:
- System-wide enplanements (71.2M) were down 11.8% from the all-time high of 80.7 million reached in January 2020.
- Domestic enplanements (62.8M) were down 11.5% from the all-time high of 71.0 million reached in January 2020.
- International enplanements (8.33M) were down 14.9% from the all-time high of 9.79 million reached in October 2019.
May unadjusted:
- Systemwide enplanements (75.8M) were down 6.9% from the all-time May high (81.3M) reached in 2019.
- Domestic enplanements (67.0M) were down 6.2% from the all-time May high (71.4M) reached in 2019.
- International enplanements (8.82M) were down 11.7% from the all-time May high (10.0M) reached in 2019.
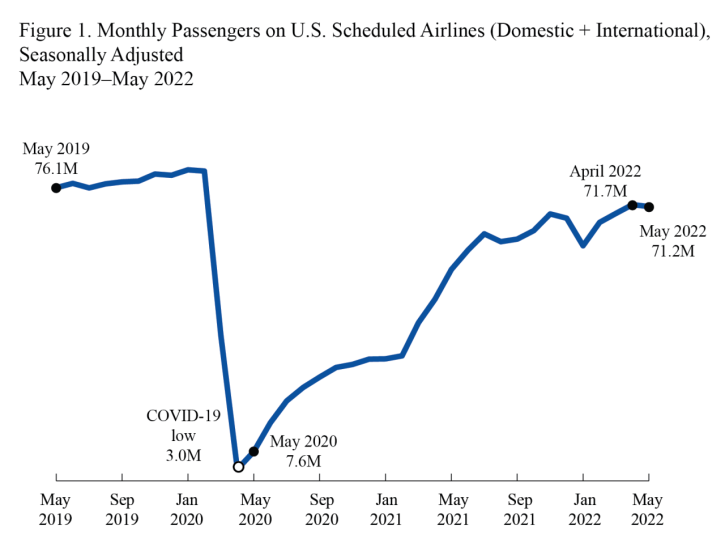
Figure 1. Monthly Passengers on U.S. Scheduled Airlines (Domestic+International), Seasonally Adjusted, May 2019-May 2022
| Enplanements | |
|---|---|
| May-2019 | 76.05 |
| June-2019 | 77.20 |
| July-2019 | 76.01 |
| August-2019 | 77.05 |
| September-2019 | 77.59 |
| October-2019 | 77.77 |
| November-2019 | 79.60 |
| December-2019 | 79.31 |
| January-2020 | 80.71 |
| February-2020 | 80.39 |
| March-2020 | 37.63 |
| April-2020 | 3.01 |
| May-2020 | 7.58 |
| June-2020 | 15.05 |
| July-2020 | 20.76 |
| August-2020 | 24.24 |
| September-2020 | 26.95 |
| October-2020 | 29.43 |
| November-2020 | 30.23 |
| December-2020 | 31.58 |
| January-2021 | 31.67 |
| February-2021 | 32.46 |
| March-2021 | 41.04 |
| April-2021 | 47.11 |
| May-2021 | 54.86 |
| June-2021 | 59.84 |
| July-2021 | 64.09 |
| August-2021 | 62.07 |
| September-2021 | 62.73 |
| October-2021 | 64.91 |
| November-2021 | 69.27 |
| December-2021 | 68.16 |
| January-2022 | 60.99 |
| Feb 2022 | 67.06 |
| Mar 2022 | 69.41 |
| Apr 2022 | 71.69 |
| May 2022 | 71.16 |
Table A. Seasonally Adjusted Passenger Enplanements Compared to Previous Time Periods
|
Seasonally Adjusted |
Passengers |
Percent Change Compared to: |
||
|
Previous |
Previous |
Three Years |
||
|
May |
71.2 |
-0.7% |
29.7% |
-6.4% |
Table B. Unadjusted Passenger Enplanements Compared to Previous Time Periods
|
Unadjusted |
Passengers |
Percent Change Compared to: |
||
|
Previous |
Two Years |
Three Years |
||
|
May |
75.8 |
31.3% |
841.0% |
-6.9% |
For data filed through May, see accompanying tables. For the complete database of reported data, see Traffic. For an explanation of BTS’ seasonal adjustment methodology, see Seasonal Adjustment.
Reporting Notes
Data are compiled from monthly reports filed with BTS by commercial U.S. air carriers detailing operations, passenger traffic and freight traffic. This release includes data received by BTS from 77 U.S. carriers as of Aug 3 for U.S. carrier scheduled civilian operations.
See the BTS Airlines and Airports page for additional scheduled service numbers through May for U.S. airlines. International data by origin and destination is available through February. International totals in this press release consist of all U.S. carrier operations to and from the U.S. and from one foreign point to another foreign point. BTS’ Airlines and Airports page does not include U.S. carriers’ foreign point-to-point flights.
BTS has scheduled September 16th for the release of data through June.
None of the data are from samples. Measures of statistical significance do not apply to the complete air traffic data.