
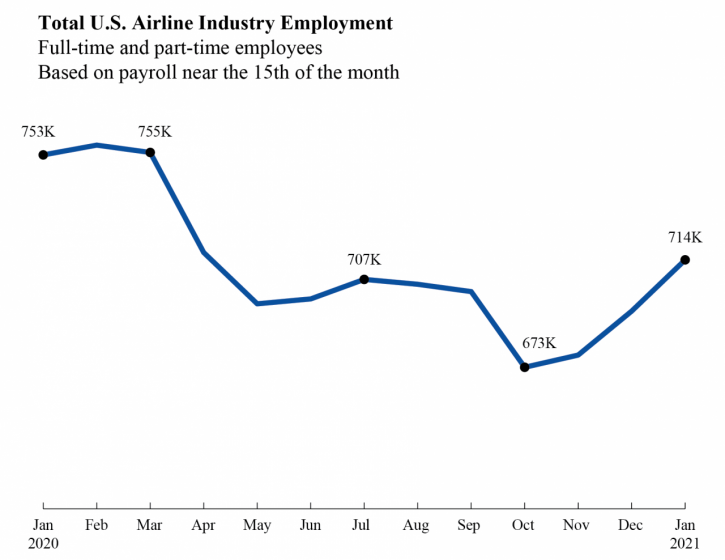
Mid-January Airline Industry Employment Up 19,311 Employees from Mid-December
U.S. airlines employed 713,949 workers in the middle of January 2021, 19,311 more than in mid-December 2020 (694,638) but 41,078 fewer than in March 2020 (755,027). The January total was the highest since April (716,693).
The employment increase from December to January was caused primarily by two factors. First, United Airlines reported an increase of 13,728 employees in January from December. Second, Piedmont Airlines, required to report for the first time in January 2021, reported 8,229 employees that were not included in previous monthly totals.
Without the addition of the Piedmont employees, the January employment total of 705,720 would be 11,082 more than December 2020. January would not have exceeded the July 2020 total of 706,824, the only month since April in which there were more airline employees than January without Piedmont.
The January industry numbers consist of 595,871 full-time and 118,078 part-time workers.
Regulations require airlines to report employment numbers to the Bureau of Transportation Statistics for employees who worked or received pay for any part of the pay period(s) ending nearest the 15th day of the month. Numbers include all paid employees but do not include employees not being paid.
Total employment (full-time + part-time) by U.S. airlines (passenger + cargo carriers):
January 2020 753,404
December 2020 694,638
January 2021 713,949
Major Airlines' Total Employees, March 2020 and January 2021
Includes Full-time and Part-time Employees
|
|
Mar-20 |
Jan-21 |
Change in Employees |
Percent Change |
|
Alaska |
17,912 |
16,736 |
-1,176 |
-6.6 |
|
Allegiant |
4,487 |
4,155 |
-332 |
-7.4 |
|
American |
109,108 |
100,409 |
-8,699 |
-8.0 |
|
Atlas |
3,121 |
3,469 |
348 |
11.2 |
|
Delta |
89,980 |
62,187 |
-27,793 |
-30.9 |
|
Envoy |
16,781 |
15,403 |
-1,378 |
-8.2 |
|
Federal Express |
245,010 |
269,023 |
24,013 |
9.8 |
|
Frontier |
5,181 |
4,996 |
-185 |
-3.6 |
|
Hawaiian |
7,492 |
5,484 |
-2,008 |
-26.8 |
|
JetBlue |
21,546 |
19,018 |
-2,528 |
-11.7 |
|
Kalitta |
2,013 |
2,240 |
227 |
11.3 |
|
Polar Air Cargo |
226 |
234 |
8 |
3.5 |
|
Republic |
6,519 |
5,662 |
-857 |
-13.1 |
|
SkyWest |
20,544 |
19,461 |
-1,083 |
-5.3 |
|
Southwest |
62,081 |
57,425 |
-4,656 |
-7.5 |
|
Spirit |
9,213 |
8,827 |
-386 |
-4.2 |
|
United |
91,563 |
76,313 |
-15,250 |
-16.7 |
|
United Parcel Service |
6,279 |
6,462 |
183 |
2.9 |
|
Major Airline Total |
719,056 |
677,504 |
-41,552 |
-5.8 |
Source: Bureau of Transportation Statistics, Airline Employment Data (P1a)
Major Carrier: Over $1 billion annual operating revenue
Additional individual airline numbers are available on the BTS airline employment web page. The web page provides full-time and part-time employment numbers by carrier by month from 1990 through January 2021.
Reports are from all U.S. airlines including scheduled passenger, charter and cargo that meet the reporting standard. Airlines that operate at least one aircraft that has more than 60 seats or the capacity to carry a payload of passengers, cargo and fuel weighing more than 18,000 pounds must report monthly employment statistics.
The next web update for full-time and part-time employment is scheduled for April 8. The BTS press release on full-time equivalent employment for scheduled passenger airlines through January, with historic comparisons and summary tables will be issued March 17.
-END-